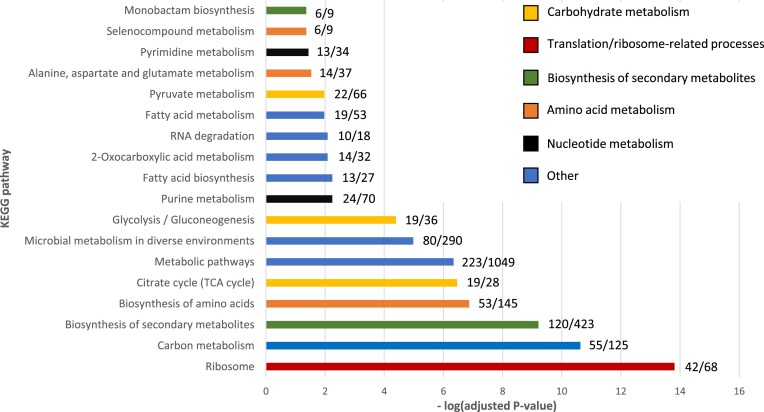
Figure 1.
KEGG enrichment analysis of the identified acetylated proteins. The numbers next to each pathway represent the number of acetylated proteins and total number of proteins in a pathway, respectively. To highlight similarities between the different enriched terms and the GO enrichment analyses in supplementary Figure S1, terms related to the same process are displayed in the same colour. Overall, terms associated with translation, the carbohydrate and amino acid metabolism are enriched.

