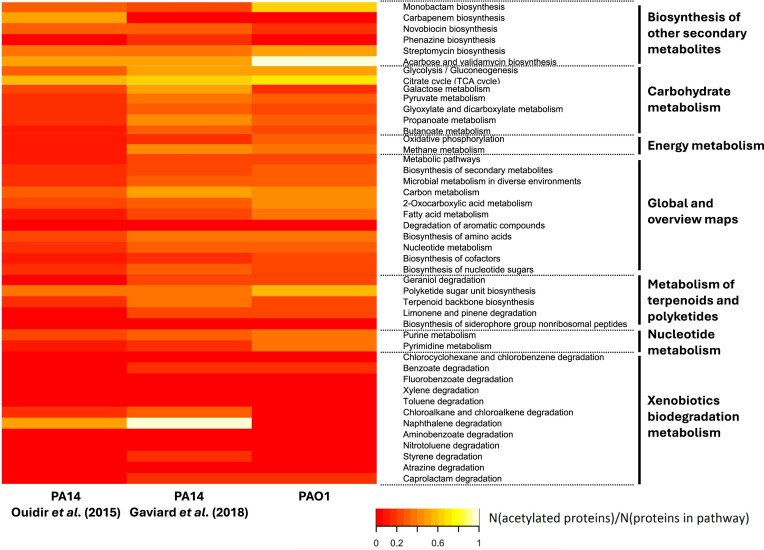
Figure 4.
Overview of acetylation levels throughout a subsection of metabolic KEGG pathways in P. aeruginosa strain PAO1 and PA14. The colour of each cell in the heatmap corresponds to the fraction of genes involved in a KEGG pathway for which their corresponding proteins were found to be acetylated. This fraction is also referred to as the acetylation level of a pathway in this paper. Specifically, two acetylomes from P. aeruginosa strain PA14 were compared with our PAO1 acetylome (Ouidir et al. 2015, Gaviard et al. 2018). Several pathways were highly acetylated in all three datasets (e.g. TCA cycle). On the other hand, for some pathways large differences could be observed, e.g. the naphthalene degradation and monobactam biosynthesis pathway. However, some of these differences may be caused by pathways containing a limited number of proteins.

