Figure 7.
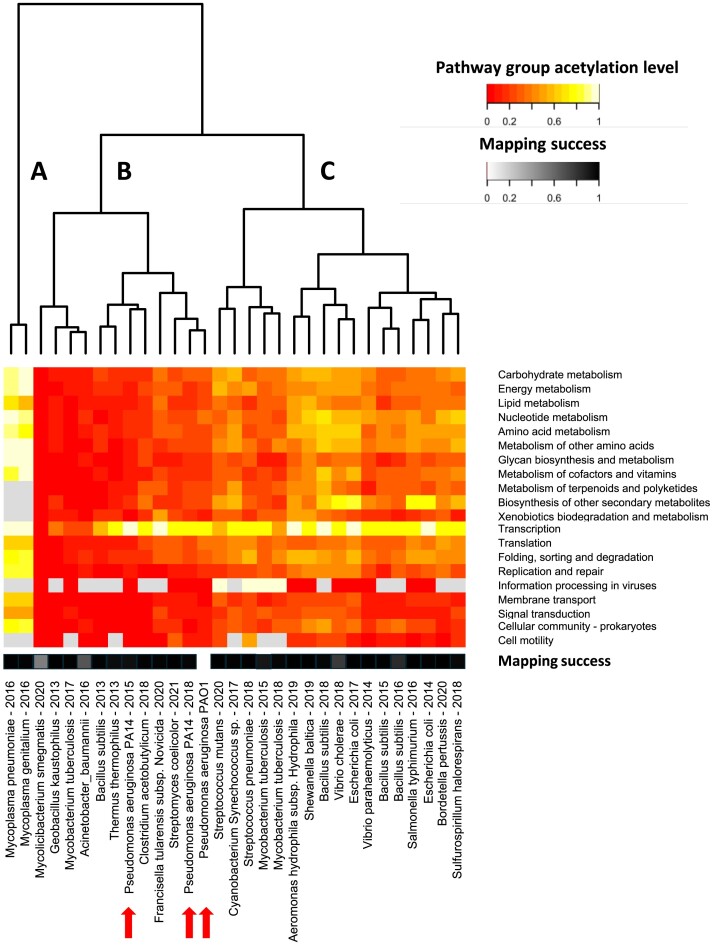
Distribution of acetylation events throughout the KEGG ‘pathways groups’ across 31 bacterial acetylomes. The colour of each cell in the heatmap corresponds to the fraction of genes involved in a KEGG pathway group for which their corresponding proteins were found to be acetylated. This fraction is also referred to as the acetylation level of the pathway group in this paper. Cells were coloured grey if no annotations were found in a particular species. If almost no annotations were available for any of the bacterial species in this comparison, the pathway group was left out of this figure. At the bottom, one row highlights the mapping success. This grayscale represents the fraction of acetylated proteins that were successfully mapped to UniProt identifiers from the original datasets. The datasets are clustered in three main clusters (A, B, C). Cluster A contains both Mycoplasma species and is characterized by high acetylation levels across all pathway groups. The remaining acetylomes are clustered in B and C. Notably, high acetylation levels for the transcription pathway group can be observed.

