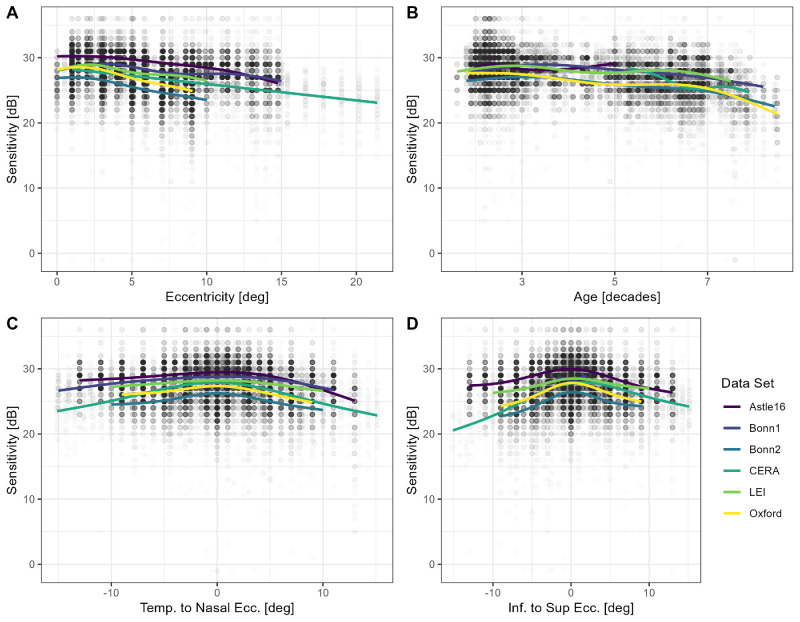
Figure 3.
Visual sensitivity. The panels show retinal sensitivity in dependence of eccentricity (A), age (B), position along the horizontal (C), and vertical (D) meridian. The colored lines are regression splines. Besides the dip in sensitivity in proximity to the fovea (fixation target), mesopic sensitivity decreases linearly with eccentricity as a first order approximation in the central visual field.

