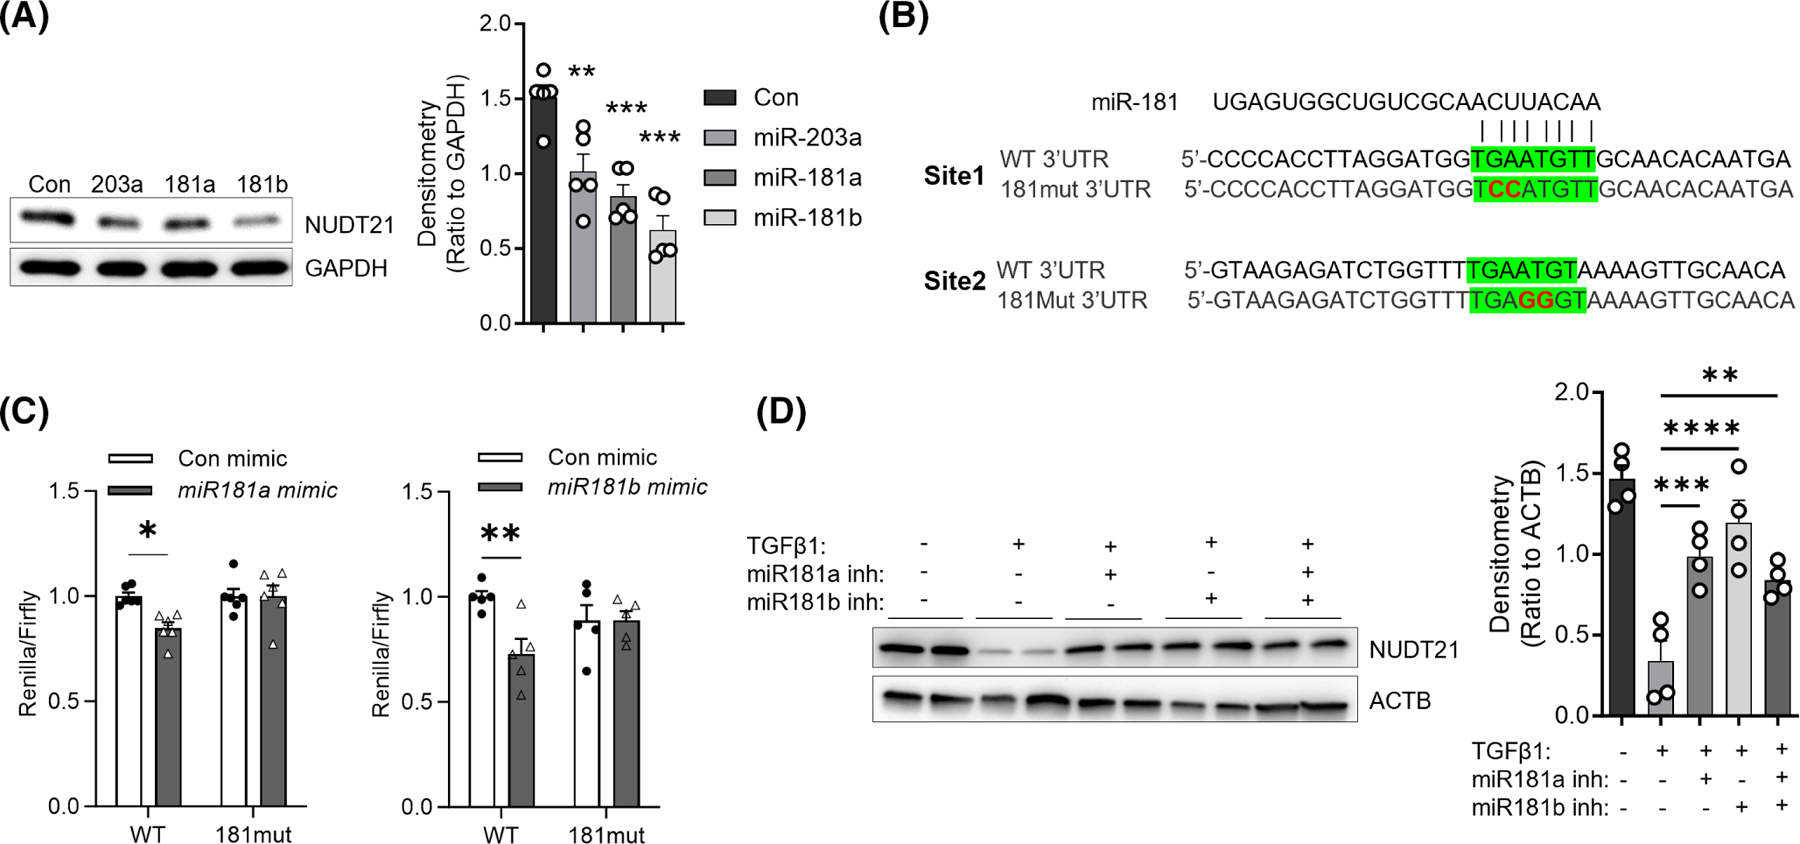
FIGURE 3.

MiR-181a and miR-181b target NUDT21 for downregulation. (A) Left panel: The protein levels of NUDT21 and ACTB were determined using Western blot in normal skin fibroblasts transfected with different miRNA mimics (50 nM in total) for 48 h. Right panel: Densitometry analysis of the Western blot image. n = 5 fibroblast lines from different donors. (B) Sequence of wild-type NUDT21 3′UTR, and mutated NUDT21 3′UTR (181mut 3′UTR) that has both miR-181a/b binding sites mutated (red fonts). Green highlight: MiR-181a/b binding sites. (C) Dual-luciferase assay of WT or mutant NUDT21 3′UTR activities in 293T cells. N ≥ 5. The graph represents means ± MSE. The p-value was determined using a two-tailed student t-test. *p < .05. (D) Left panel: The protein levels of NUDT21 and ACTB in primary human normal dermal fibroblasts transfected with 50 nM control, miR-181a, miR-181b, or both inhibitors on day 0 and day 2 and treated with vehicle or 5 ng/mL TGFβ1 for 4 days. Right panel: Densitometry analysis of the Western blot image. n = 4 fibroblast lines from different donors. p-values were calculated by one-way ANOVA for A and D and two-way ANOVA for C followed by Dunnett’s comparisons test. *p < .05; **p < .01; ***p < .001; ****p < .0001.
