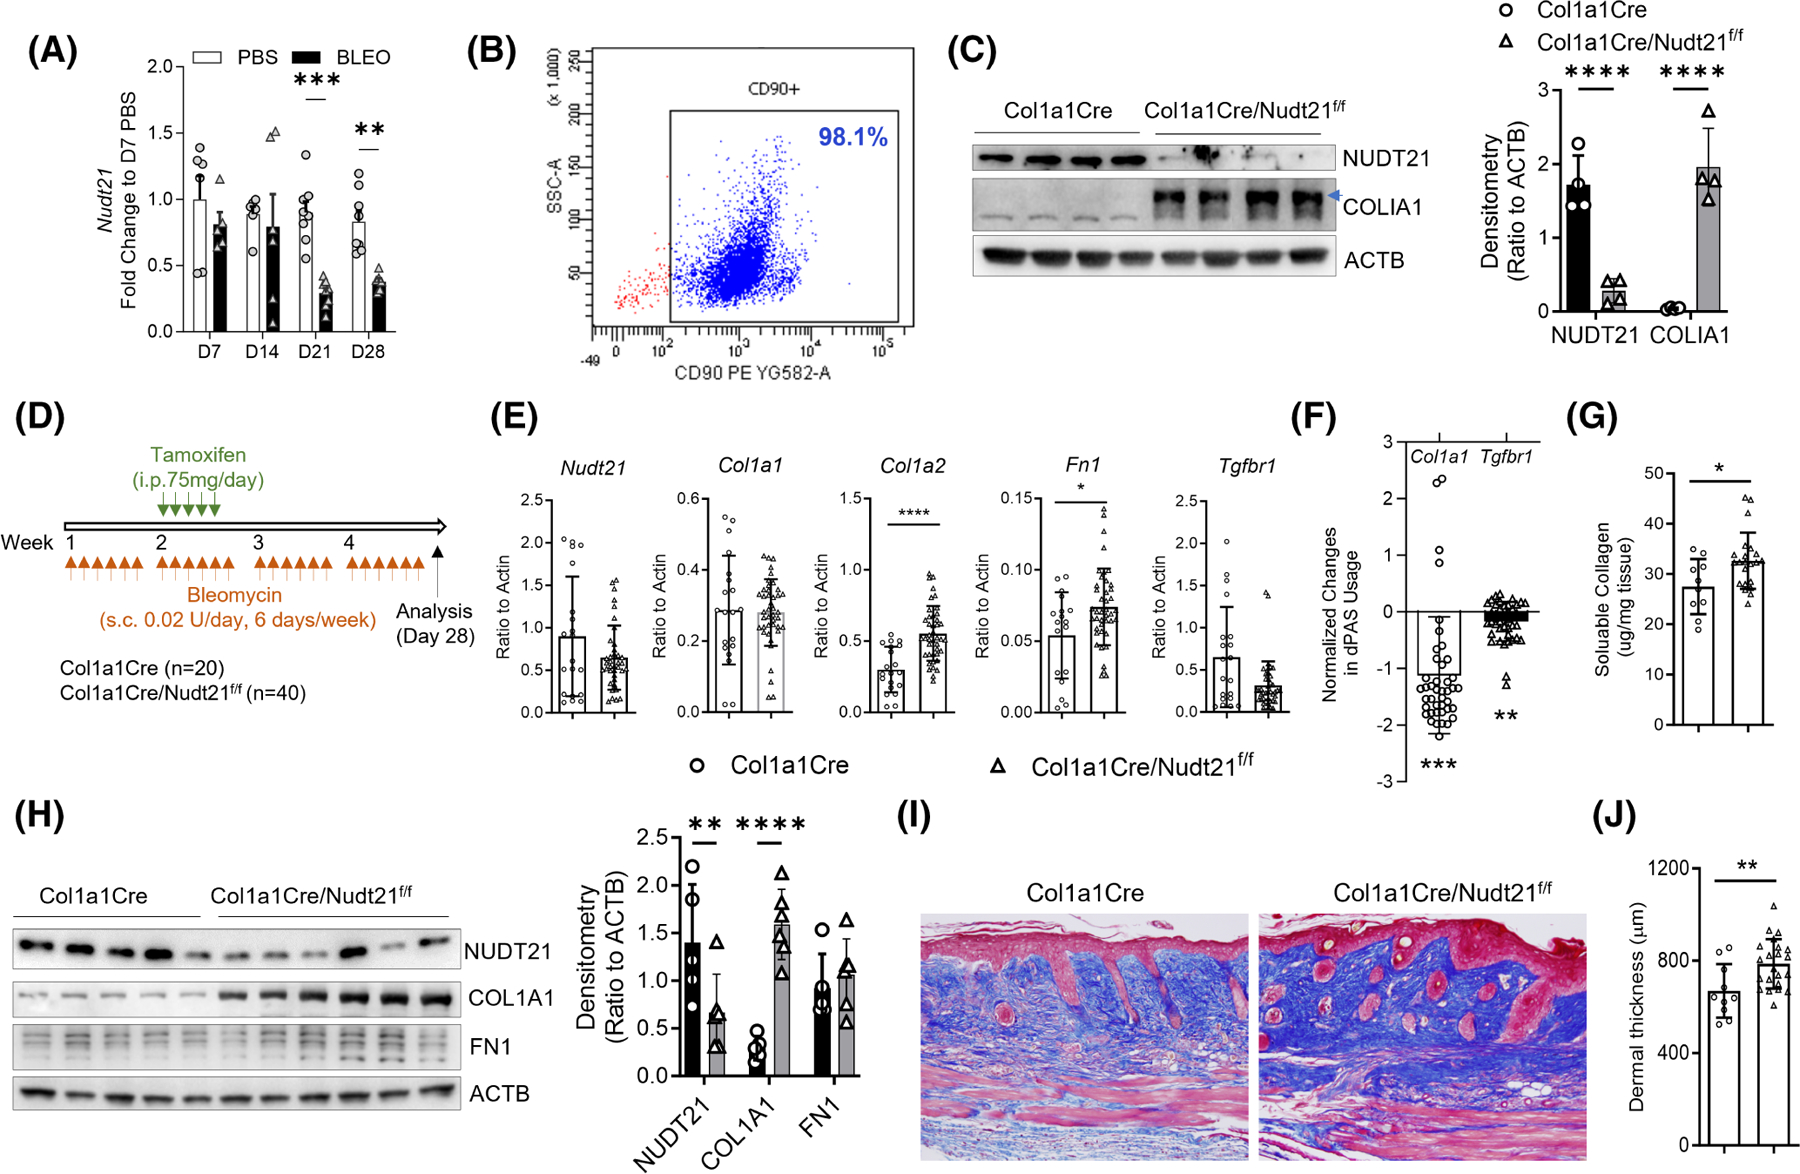
FIGURE 4.

Delayed Nudt21 depletion exaggerates bleomycin-induced skin fibrosis. (A) The transcript levels of Nudt21 at different time points were determined in skin of female WT mice s.c. injected with PBS or 0.02 U/day bleomycin six times a week for 4 weeks. (B) Six–eight-week-old Col1a1Cre or Col1a1Cre/Nudt21f/f female mice were i.p. injected with 75 mg/day tamoxifen daily for 5 days. One week after the last tamoxifen injection, primary mouse fibroblasts were isolated for analysis. Flow cytometry of primary isolated mouse skin fibroblasts showing more than 95% of cells are CD90 positive. (C) Left panel: Western blot of primary isolated skin fibroblasts showing NUDT21 and COLIA1 levels. Right panel: Densitometry analysis of the Western blot image. n = 4 fibroblast lines from different mice. (D–J) Female Col1a1Cre or Col1a1Cre/Nudt21f/f mice were injected with repeated s.c. bleomycin six times a week for 4 weeks. One week after the first bleomycin injection, mice were i.p. injected with 75 mg/day tamoxifen daily for 5 days to induce cre recombination. Skin was analyzed on day 28. (D) Scheme of experimental design. (E) Real-time qRT PCR was performed to determine the transcript levels of Nudt21, Col1a1 Col1a2, Fn1, and Tgfbr1 in the skin. (F) Real-time qRT PCR was performed to determine the APA of Col1a1 in the skin. Data were presented as . (G) Sircol assay was performed to determine the pepsin-soluble collage levels in the skin. (H) Left panel: Western blot was performed to determine the protein levels of NUDT21, COL1A1, FN1, and ACTB. Right panel: Densitometry analysis of the Western blot image. n ≥ 5 skin from different mice. (I) Representative Masson’s Trichrome staining images. Scale bar =50 μm. (J) Histological dermal thickness. The graph represents means ± MSE. The p-value was determined using a two-tailed student t-test, and the p-values for panels A, C, and G were Bonferroni corrected. *p < .05; **p < .01; ***p < .001; ****p < .0001.
