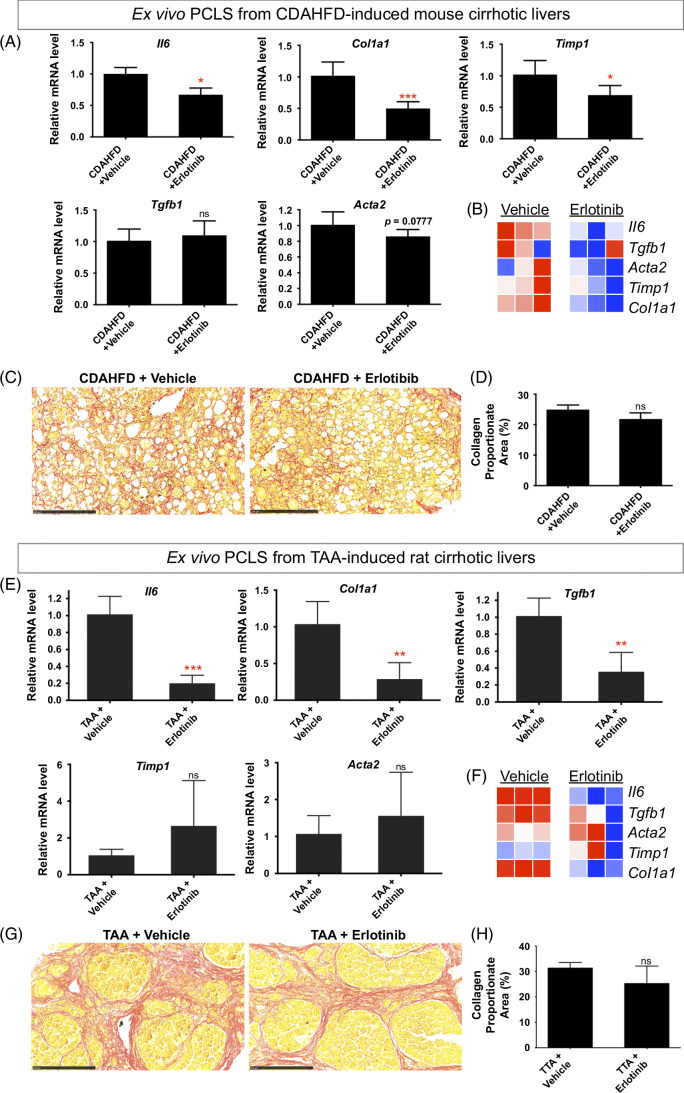
FIGURE 2.
Antifibrotic evaluation in PCLS from CDAHFD-induced mouse cirrhosis and TAA-induced rat cirrhosis. (A) Quantitative RT-PCR analysis of profibrogenic genes. (B) Heatmap of profibrogenic genes from 3 independently repeated experiments. Amount of collagen (C) measured with Sirius red staining and (D) quantified with collagen proportionate area analysis in PCLS from CDAHFD-induced mouse cirrhosis after 5 μM erlotinib treatment for 72 hours. (E) Quantitative RT-PCR analysis of profibrogenic genes. (F) Heatmap of profibrogenic genes from 3 independently repeated experiments. Amount of collagen (G) measured with Sirius red staining and (H) quantified in PCLS from TAA-induced rat cirrhosis after 5 μM erlotinib treatment for 72 hours. The images of Sirius red staining for both CDAHFD and TAA models were presented at ×20 magnification. Experiments were independently repeated 3 times (n = 4). All values were expressed as the mean ± SEM with 2-tailed Student’s t tests. Significance is represented by *p < 0.05, **p < 0.01, ***p < 0.001, ns indicates not significant. Abbreviations: CDAHFD, choline-deficient, l-amino acid–defined, high-fat diet; PCLS, precision-cut liver slices; RT-PCR, reverse transcription polymerase chain reaction; TAA, thioacetamide.

