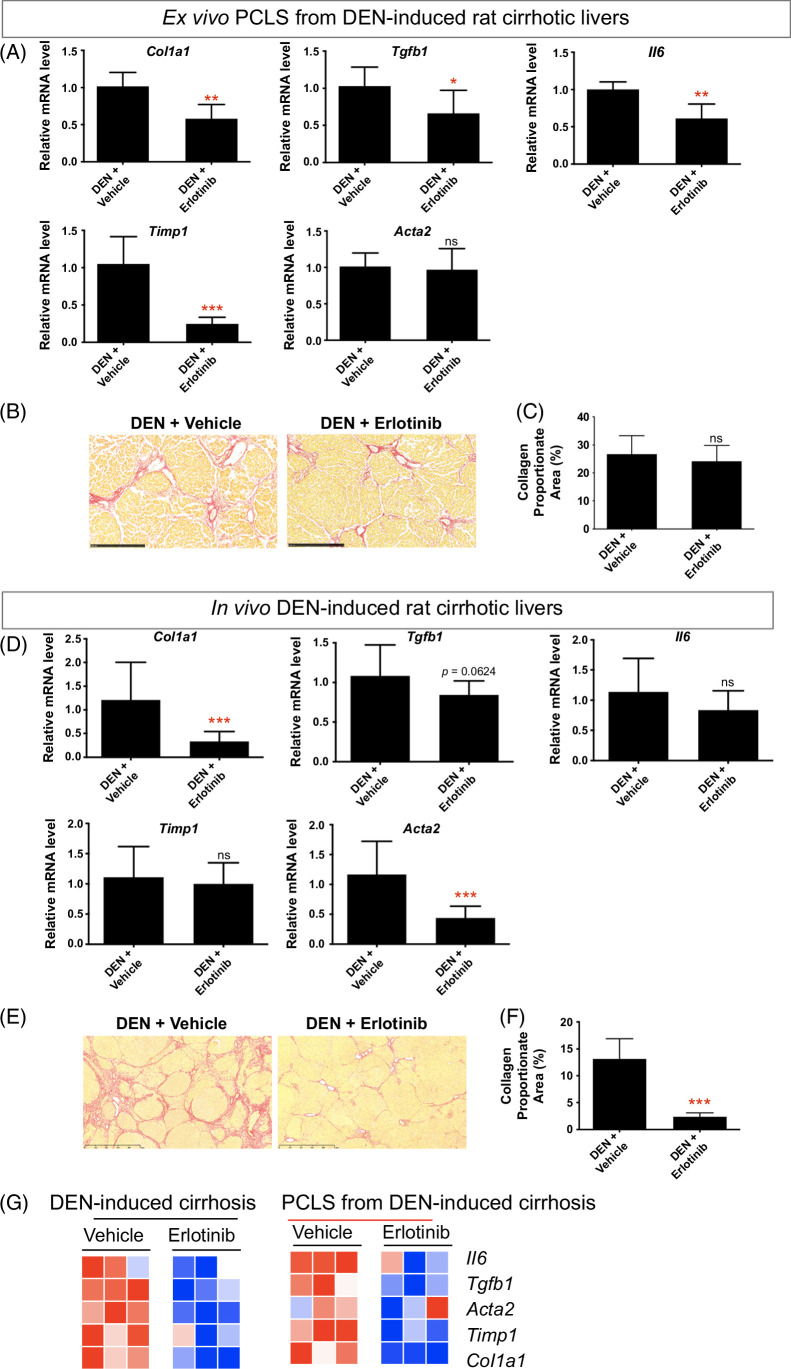
FIGURE 3.
Comparison of antifibrotic therapy in ex vivo PCLS from DEN-induced rat cirrhosis with in vivo DEN cirrhotic model. For ex vivo PCLS analysis, (A) quantitative RT-PCR analysis of profibrogenic genes. Amount of collagen (B) measured with Sirius red staining and (C) quantified with collagen proportionate area analysis in PCLS after 5 μM erlotinib treatment for 72 hours. Experiments were independently repeated 3 times (n = 4). For in vivo analysis, (D) quantitative RT-PCR analysis of profibrogenic genes. Amount of collagen (E) measured with Sirius red staining and (F) quantified after daily i.p. injections of 2 mg/kg erlotinib for 10 weeks. (G) Comparison of heatmaps of profibrogenic genes for corresponding models. All values were expressed as the mean ± SEM with 2-tailed Student t tests. Significance is represented by *p < 0.05, **p < 0.01, ***p < 0.001, ns indicates not significant. Abbreviations: DEN, diethylnitrosamine; PCLS, precision-cut liver slices; RT-qPCR, reverse transcription quantitative polymerase chain reaction.

