FIGURE 5.
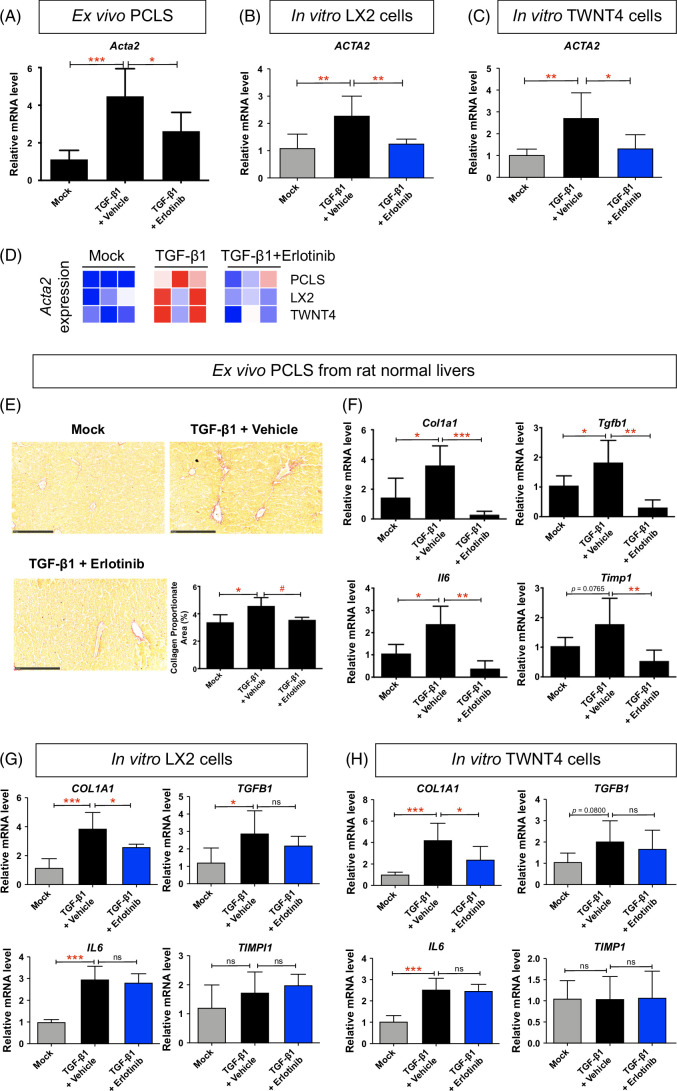
Comparison of antifibrotic evaluation in ex vivo HSCs from PCLS with in vitro HSCs. Quantitative RT-PCR analysis of Acta2 mRNA from (A) PCLS from normal rats, (B) LX2, and (C) TWNT4 cells. PCLS or HSCs were activated with 10 ng/mL TGF-β1 for 24 hours and further treated with 5 μM erlotinib for 72 hours. (D) Heatmap of Acta2 expression in corresponding models. (E) Amount of collagen measured with Sirius red staining and quantified with collagen proportionate area analysis in PCLS from normal rats. Quantitative RT-PCR analysis of Il6, Tgfb1, Timp1, and Col1a1 mRNA from (F) PCLS from normal rats, (G) LX2, and (H) TWNT4 cells. These experiments were repeated 3 times (n = 4). All values were expressed as the mean ± SEM with 1-way ANOVA analysis. Significance is represented by *p < 0.05, **p < 0.01, ***p < 0.001, ns indicates not significant. Abbreviations: PCLS, precision-cut liver slices; RT-qPCR, reverse transcription quantitative polymerase chain reaction.

