FIGURE 6.

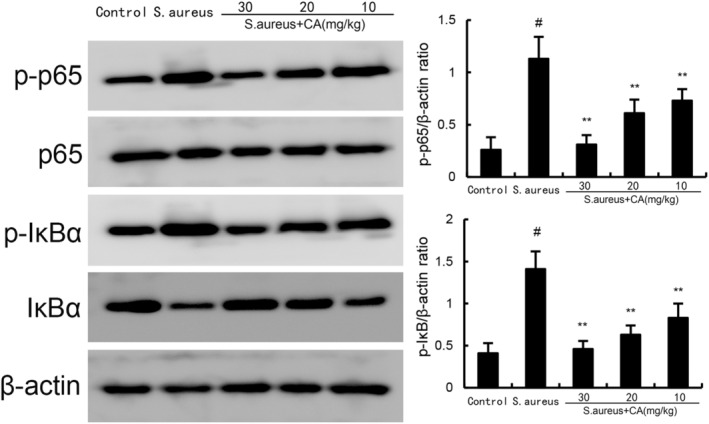
Effect of CA on NF‐κB activation in uterine gland. The values presented are the mean ± SD. # p < 0.01 is significantly different from control group; **p < 0.01 are significantly different from Staphylococcus aureus group.

Effect of CA on NF‐κB activation in uterine gland. The values presented are the mean ± SD. # p < 0.01 is significantly different from control group; **p < 0.01 are significantly different from Staphylococcus aureus group.