Fig. 3.
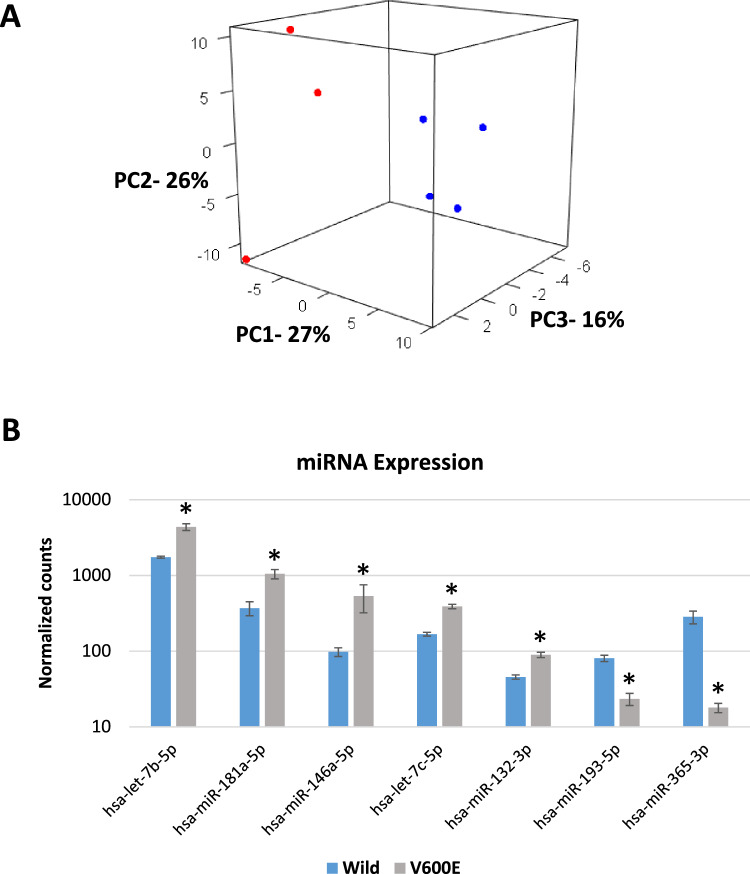
MicroRNA expression in colon organoids (A) Principal component analysis of microRNA expression in organoids derived from four SSLs from SPS patients and three APs from FAP patients. 3D figure shows first three components (PC1-PC3) accounting for approximately 70% of the variation in the data. Log2 ratios were calculated by comparing each polyp to its uninvolved control. Red denotes two SSLs and one AP with BRAF V600E mutation (n = 3) and blue denotes three SSLs and one AP without BRAF mutation (n = 4). (B) Relative expression of seven microRNAs (miRNAs) differentially expressed in three BRAF V600E mutant, two SSLs and one AP, compared to four BRAF wildtype, three SSLs and one AP, organoids. Bar graphs show the mean and standard error of normalized read counts for each miRNA. Statistical significance determined by DESeq2, FDR < 0.05

