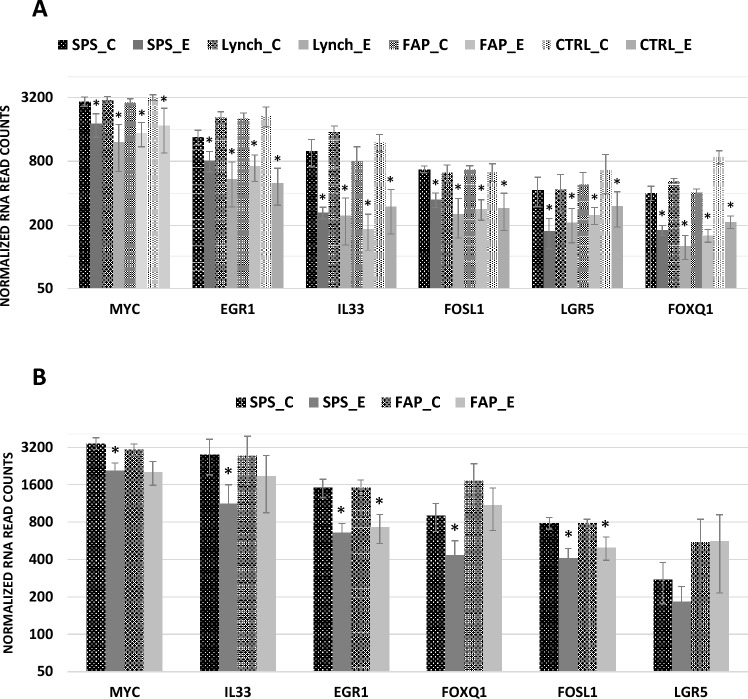
Fig. 4.
RNA expression in control and erlotinib treated colon organoids (A) RNA expression of MYC, EGR1, IL33, FOSL1, LGR5 and FOXQ1 in control (C) and erlotinib (E) treated organoids derived from uninvolved colon from SPS, FAP, Lynch and control (non-syndromic patients with average cancer risk) patient cohorts. Bar graphs show the mean and standard error (n = 4–6) of normalized read counts for each gene. Statistical significance determined by DESeq2, FDR < 0.05. (B) RNA expression of MYC, EGR1, IL33, FOSL1, LGR5 and FOXQ1 in control (C) and erlotinib (E) treated organoids derived from SSLs from SPS patients and APs from FAP patients. Bar graphs show the mean and standard error (n = 4–6) of normalized read counts for each gene. Statistical significance determined by DESeq2, FDR < 0.05

