Fig. 5.
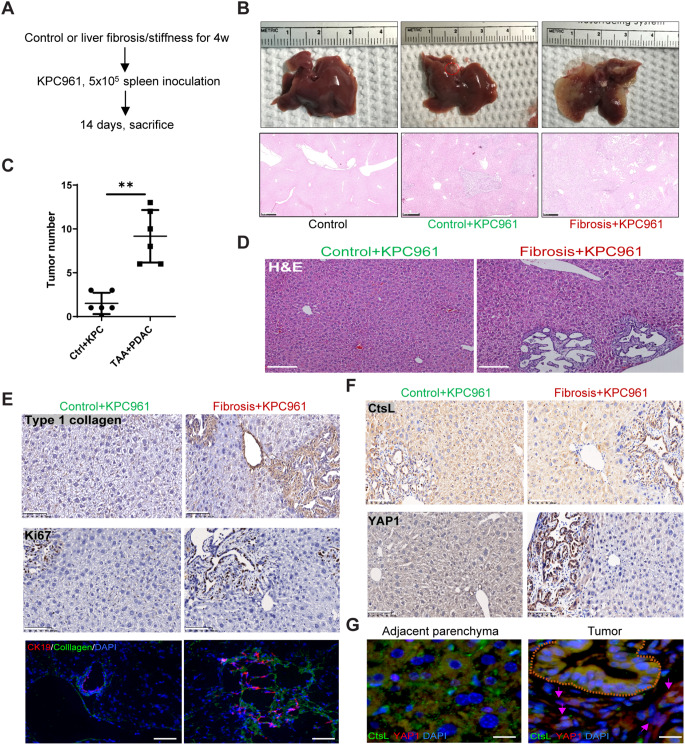
PDAC tumorigenesis and metastasis are promoted in the fibrotic liver (A) Schematic representation of the experimental design used to determine the impact of liver fibrosis/stiffness on tumorigenicity. The mice were treated with or without TAA for 4 weeks, followed by inoculation of UN-KPC961 cells for 2 weeks (n = 6). (B) Gross examination (upper row) and H&E staining (lower row) of control and tumor-bearing livers. Scale bar = 500 μm. (C) Quantitation of tumor numbers in normal or fibrotic liver sections. (D) H&E staining of normal or fibrotic liver sections, scale bar = 200 μm. (E) Immunohistochemical staining of type-I collagen, Ki67 and CK19 in normal or fibrotic liver sections, scale bar = 100 μm. (F) Immunohistochemical staining of YAP1 and CtsL in normal or fibrotic liver sections, scale bar = 100 μm. (G) Immunofluorescence staining of CtsL and YAP1 in PanIN and adjacent hepatic parenchyma. The PanIN ducts are indicated by brown dashed lines, and malignant cells are indicated by pink arrows, scale bar = 25 μm. The values are presented as mean ± SD; **p < 0.01

