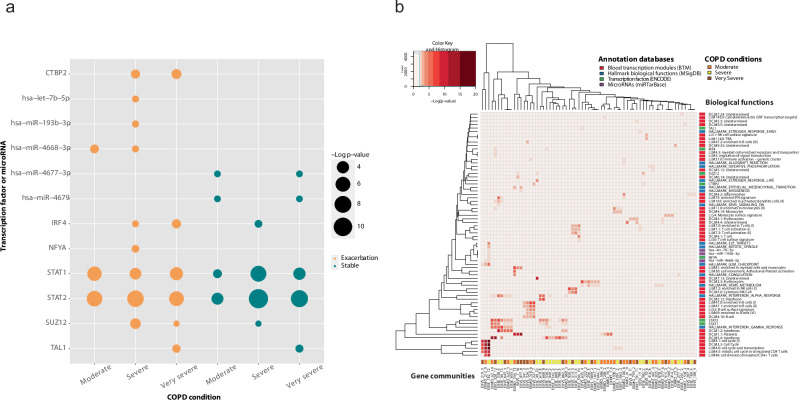
Fig. 4. Gene communities identified in stable state and exacerbation with different levels of airway obstruction severity.
a The enriched transcription factors and microRNAs for each COPD severity grade in exacerbation and stable condition. b A heatmap, where columns represent genes communities from acute exacerbation events stratified by moderate (EXMO label), severe (EXSE), and very severe (EXVS) classification of the disease, and the rows represent associated biological functions (annotated in blood transcription modules, microRNA targets, transcription factor targets, and Hallmark biological functions). Each cell of the heatmap is colored proportionally to the average Benjamini-Hochberg corrected log10 p value, testing the enrichment of the ith biological function in the jth gene community. COPD, chronic obstructive pulmonary disease.

