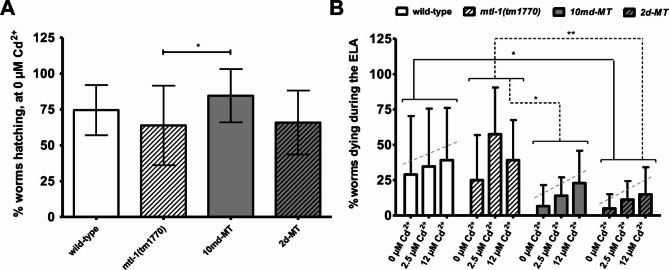
Fig. 3.
Nematode hatching rate and mortality during the setup phase of the Egg-laying assay. Diagrams display the hatching rate at 0 µM Cd2+ conditions (A), and death rates (B) for the strains N2, mtl-1, 10md-MT, and 2d-MT under an exposure regime of rising Cd2+ concentrations (0, 2.5 and 12 µM Cd2+). at. Statistical analysis was conducted on the following sample size: N2: 16 worms in 5 experiments; mtl-1: 11 worms in 8 experiments; 10md-MT: 19 worms in 5 experiments, 2d-MT: 21 worms in 5 experiments. Error bars indicate the standard deviation at 95% confidence. Welch’s t-tests have been performed on data groups pooled among Cd2+ concentrations, as indicated by the horizontal brackets. Significance is marked by asterisks.

