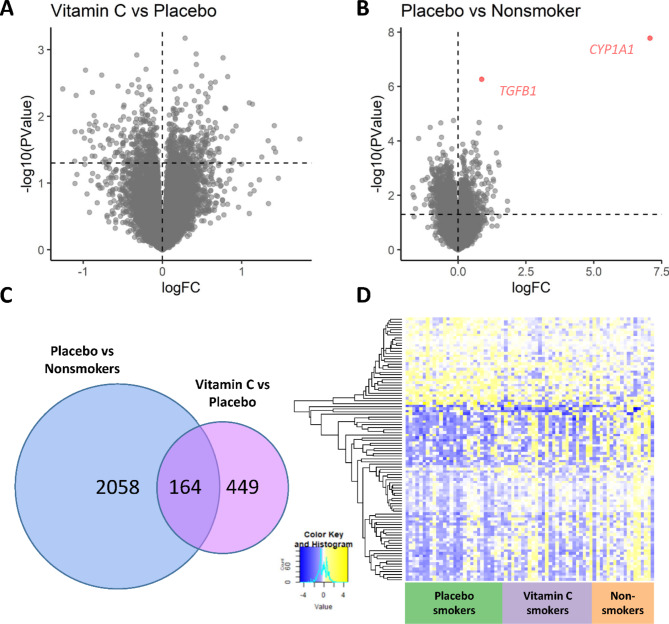
Fig. 4.
RNA-sequencing results of placentas. Volcano plots show difference in log fold change (log FC) versus –log10 p-value in vitamin C vs. placebo (A) and placebo vs. nonsmokers (B) Lines at y = 1.3 are equivalent to nominal p = 0.05. (C) Venn-diagram shows overlap of nominally significant changes in expression between groups. (D) Heatmap for overlapping set of 164 genes shown in C with nominally significant differential expression in placentas from smokers randomized to placebo vs. nonsmokers and in placentas from placebo vs. vitamin C-treated smokers. Columns represent individual subjects and rows represent individual genes. The mean direction of effect in 160/164 overlapping genes was reversed with vitamin C.

