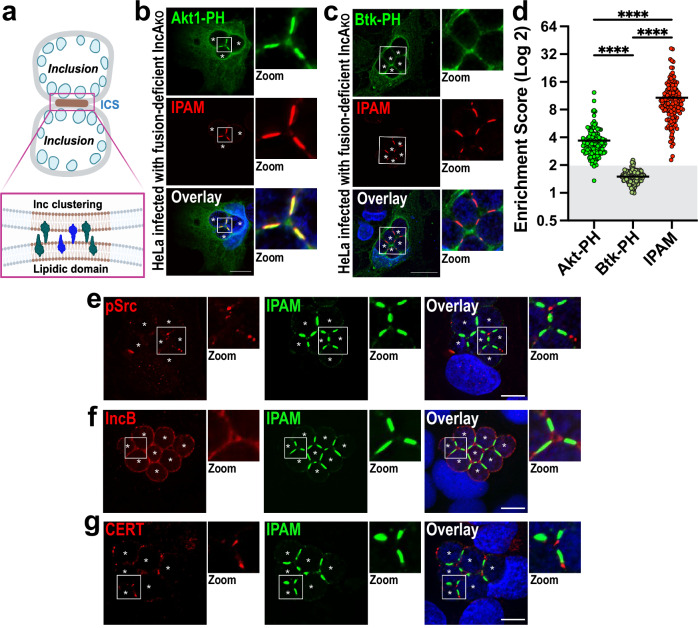
Fig. 1. Inclusions form unique contact sites (ICSs).
a Schematic depicts ICSs as points of contact between inclusion membranes in which specific lipids (brown) and proteins (green and blue) are clustered (see insert). Created in BioRender. Paumet, F. (2023) BioRender.com/s94s603. b–d HeLa cells were infected with IncAKO Ctr (MOI 3). At 2 hpi, cells were transfected with plasmids expressing Akt-PH-GFP (b, green) or Btk-PH-GFP (c, green). Cells were then fixed at 24 hpi and labeled with anti-IPAM antibody (red). DNA was stained with Hoechst (blue). Enlarged ICSs (white box) are shown in the Zoom panel. Scale bar = 20 μm. Images are representative of three independent experiments. d ESs were calculated and plotted for each probe and IPAM as a control. Each dot = individual ES, black horizontal bar = mean. Gray box denotes ESs <2. n = 150 total scores per probe from three independent experiments. ns = not significant, **** denotes p-value < 0.0001 (one-way ANOVA). e–g IncAKO Ctr infected cells were fixed at 24 hpi and labeled with anti-IPAM (green) and anti-pSrc (e), anti-IncB (f), or anti-CERT (g) antibodies (red). DNA was stained with Hoechst (blue). Enlarged ICSs (white box) are shown in the Zoom panel. Scale bar = 10 μm. Asterisks mark the inclusions. Images are representative of three independent experiments.

