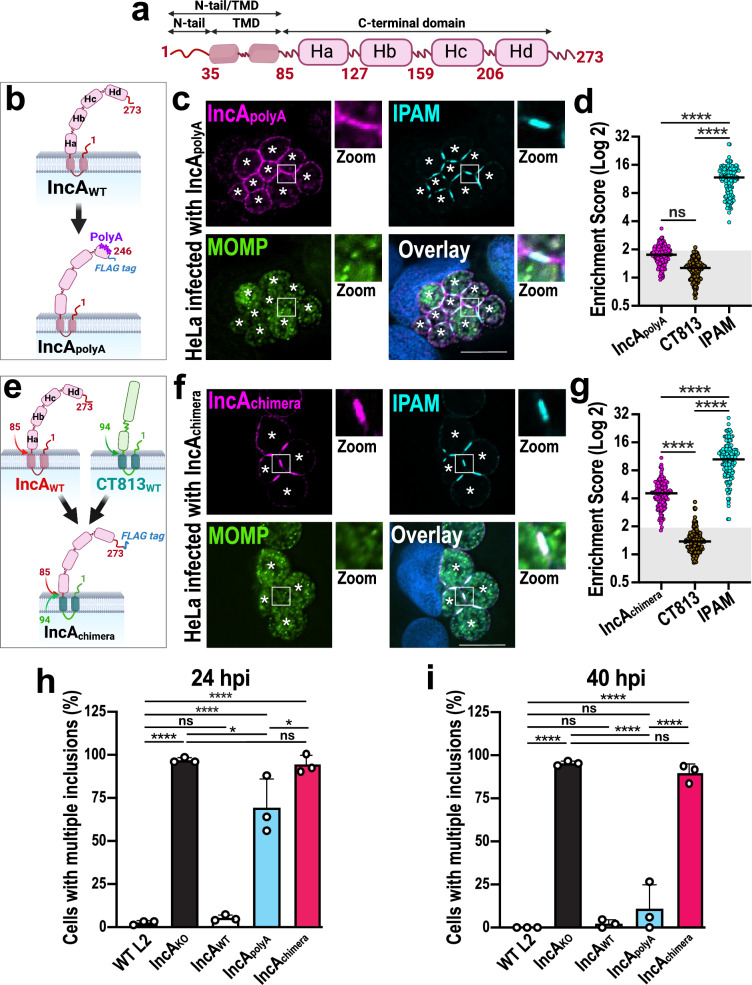
Fig. 3. The C-terminal domain of IncA controls IncA clustering in ICSs and regulates homotypic fusion.
a Schematic of full-length IncA, displaying an N-terminal tail (N-tail) and transmembrane domain (TMD), as well as four C-terminal helices (Ha-d). The N-tail and the C-terminal domain face the host cytoplasm, while the TMD anchors IncA in the inclusion membrane. Created in BioRender. Paumet, F. (2023) BioRender.com/z33h938. b Schematic of IncApolyA-FLAG in which Hd residues were mutated to alanines to disrupt critical intramolecular contacts to create the IncApolyA-FLAG complemented mutant strain16. Created in BioRender. Paumet, F. (2023) BioRender.com/u70l441. c HeLa cells were infected with IncApolyA-FLAG Ctr (MOI 5) for 24 h in the presence of anhydrotetracycline. Cells were fixed and labeled with anti-FLAG (magenta, labels IncApolyA-FLAG), anti-IPAM (cyan), and anti-MOMP (green) antibodies. DNA was stained with Hoechst (blue). Asterisks denote the inclusions; Scale bar = 10 μm. Images are representative of three independent experiments. d ESs for cells infected with IncApolyA-FLAG Ctr at 24 hpi. N = 150 total scores per Inc from three independent experiments. Gray box denotes ESs <2. ns = not significant, **** denotes p-value < 0.0001 (one-way ANOVA). e Schematic of IncAchimera-FLAG in which IncA N-tail and TMD were swapped for those of CT813, to create the IncAchimera-FLAG complemented mutant strain. Created in BioRender. Paumet, F. (2024) BioRender.com/f62h052. f Cells were infected with IncAchimera-FLAG Ctr (MOI 5) for 24 h, fixed, and labeled as in c. Asterisks denote inclusions; Scale bar = 10 μm. Images are representative of three independent experiments. g ESs were calculated as in d. **** denotes p-value < 0.0001 (one-way ANOVA). h, i Homotypic fusion was quantified for the indicated strains in infected cells (MOI 7) at 24 hpi (h) and 40 hpi (i). Graphs depict the average number of cells containing multiple inclusions +/- SD from three independent experiments. ns = not significant, * denotes p-value < 0.05, **** denotes p-value < 0.0001 (one-way ANOVA).

