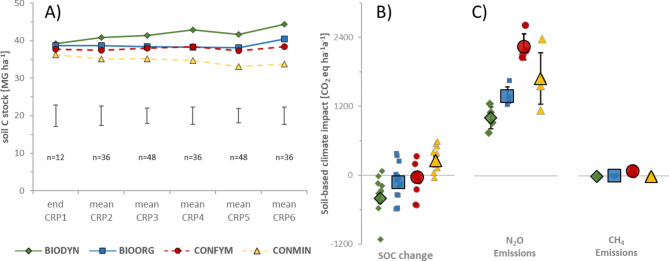
Fig. 2.
Soil borne greenhouse gas emissions as influenced by cropping systems. Panel (A) shows soil organic carbon stock change from 2nd to 6th crop rotation period (CRP, 1984–2019). Error bars represent least significant difference between system in a given CRP. In panel (B) least square means of annual soil carbon stock (SOC) changes from 2nd to 6th CRP expressed as CO2 equivalents (n = 12 + SE). (C) Least square means of annual area-scaled N2O and CH4 emissions across a grass-clover, maize and green manure sequence within 6th CRP57 expressed as CO2 equivalents (n = 4 + SE). Small symbols in panel (B) and (C) represent individual observations from experimental plots. System boundary for greenhouse gas emissions is the field site.

