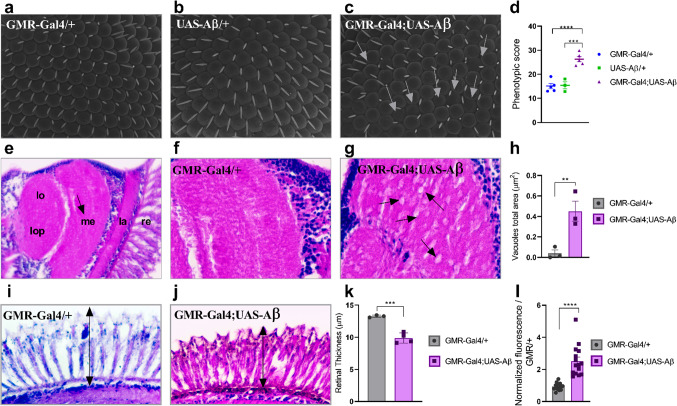
Fig. 1.
Flies with the genotype GMR-Gal4/+;UAS-Aβ/+ showed a degenerative phenotype. Representative SEM images obtained at 1200x magnification. (a) GMR-Gal4/+ (b) UAS-Aβ/+ (c) GMR-Gal4;UAS-Aβ; white arrows indicate disordered ommatidia (d) Phenotypic score determined through quantitative analyses using the Flynotyper plugin on ImageJ, flies GMR-Gal4;UAS-Aβ presented a higher score than both the GMR-Gal4/+ and UAS-Aβ/+ controls (p < 0.0001 and p = 0.0004, respectively)n ≥ 3.e) Representative 3-µm paraffin sections of the fly head GMR-Gal4/+, 40× magnification indicating the different parts of the visual system in the optic lobe: retina (re), lamina (la), medulla (me), lobe (lo), and lobe plate (lop); the black arrow indicates the regions analyzed for vacuolar lesions. f) GMR-Gal4/+ at 100× magnification. g) GMR-Gal4/+;UAS-Aβ/+ at 100× magnification; the black arrows indicate vacuolar lesions. h) Total vacuole area. There was a greater area of vacuoles in the GMR-Gal4;UAS-Aβ fly than in the control genotype (p = 0.0083) n = 3. i) Representative retinal thickness of GMR-Gal4/+, 100× magnification; the black arrow indicates the measured region. j) Representative retinal thickness of GMR-Gal4/+;UAS-Aβ/+, 100× magnification; the black arrow indicates the measured region. k) Retinal thickness quantification. The GMR-Gal4;UAS-Aβ flies presented a thinner retina than the genotype control (p = 0.0009) n = 3. l) Relative amyloid content in the GMR-Gal4;UAS-Aβ flies presented a greater amyloid content than the GMR/+ flies (p < 0.0001) triplicate of pool with 10 heads in each. All data are shown as individual values, the mean ± S.E.M. (two-tailed ANOVA and unpaired t test) and all images are of flies at 1–2 days post-eclosion (d.p.e.).

