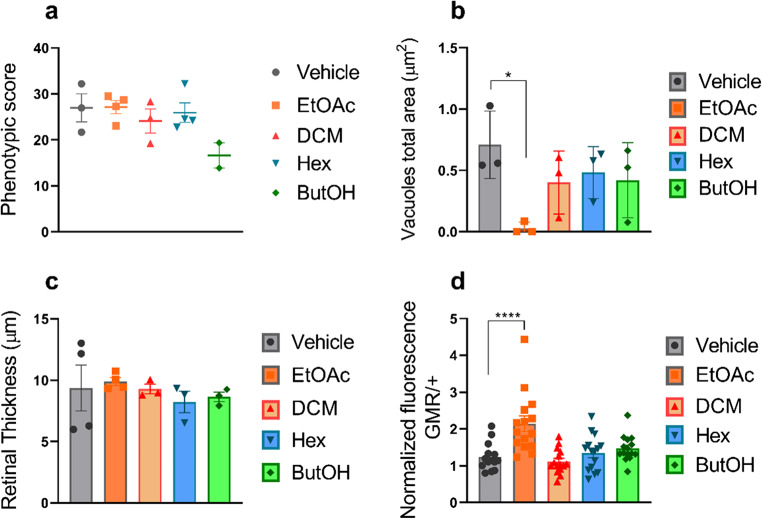
Fig. 3.
Quantitative analysis of metabolic fraction-treated flies. (a) Phenotypic score determined through quantitative analyses using the Flynotyper plugin on ImageJ. None of the treatment groups presented significant differences compared with the control group (vehicle) (p > 0.5) n ≥ 3. (b) Total vacuole area. Compared with control flies, only flies treated with the EtOAc fraction presented a reduced total area of vacuoles (p = 0.023) n = 3. (c) Retinal thickness. None of the treatment groups presented significant differences compared with the control group (vehicle) (p > 0.5) n = 3. (d) Relative amyloid quantification through ThT assay; only flies treated with the EtOAc fraction presented a greater amyloid content than did the control group (p < 0.0001) triplicate of of pool with 10 heads in each. The data are shown as individual values, the mean ± S.E.M. (unpaired t test).

