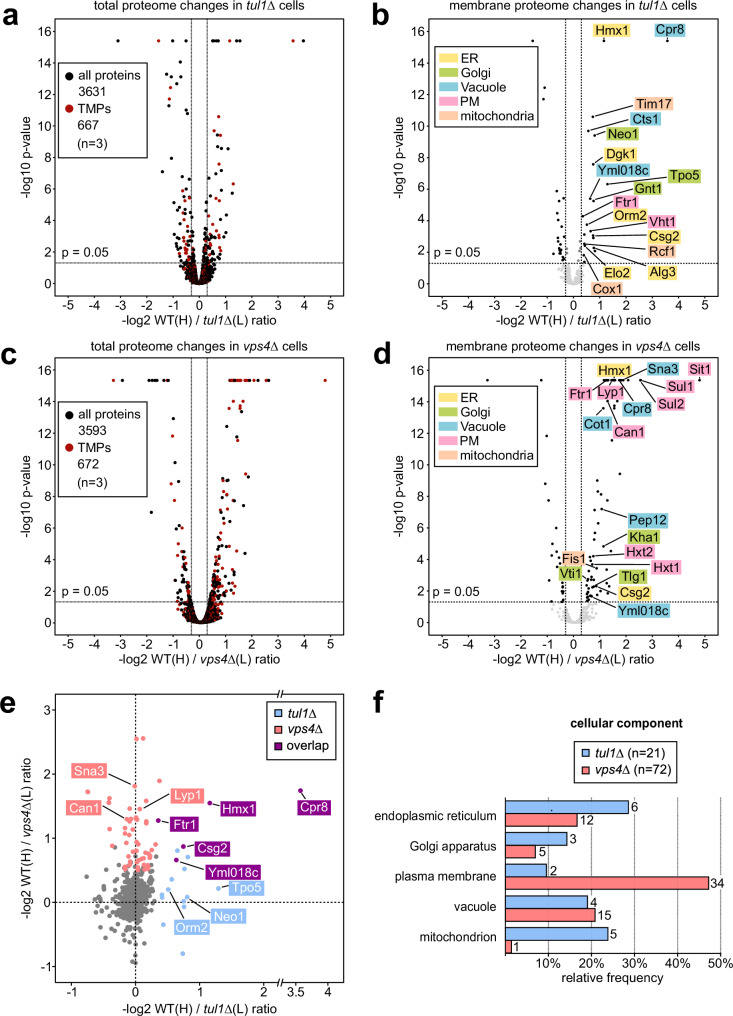
Fig. 1. Quantitative proteomic SILAC profiling of Dsc complex and ESCRT mutants.
a–d Volcano plots showing the H/L peptide ratios of proteins from heavy 13C6,15N2-L-lysine labeled WT cells against light 12C6,14N2-L-lysine L-lysine labeled tul1Δ a, b or vps4Δ c, d mutants (n = 3 independent experiments). Total proteome of a WT / tul1Δ mutants or c WT / vps4Δ mutants, transmembrane proteins (TMPs) in red; b, d only transmembrane proteome. Significantly regulated (−log2 ≥ 0.3, p ≤ 0.05) transmembrane proteins in black. See also Supplementary Data 1, 2. e Scatter plot of the 614 membrane proteins quantified in WT/tul1Δ (x-axis) and in WT/vps4Δ (y-axis), only displaying proteins with −log2 > −1. Proteins which are significantly upregulated (-log2 ≥ 0.3, p ≤ 0.05) in both datasets are highlighted: Dsc complex-dependent (light blue), ESCRT-dependent (light red), and overlapping substrates (purple). See also Supplementary Data 3. a–e The p-values were calculated by using the background based t-test, the adjusted p-values by using the Benjamin-Hochberg method. f Gene Ontology (GO) analysis for cellular components of the significantly upregulated transmembrane proteins in tul1Δ (light blue) or vps4Δ (light red) cells. Only GO terms with ≥ 2 hits are shown as relative frequency over the data set. See also Supplementary Table 1.

