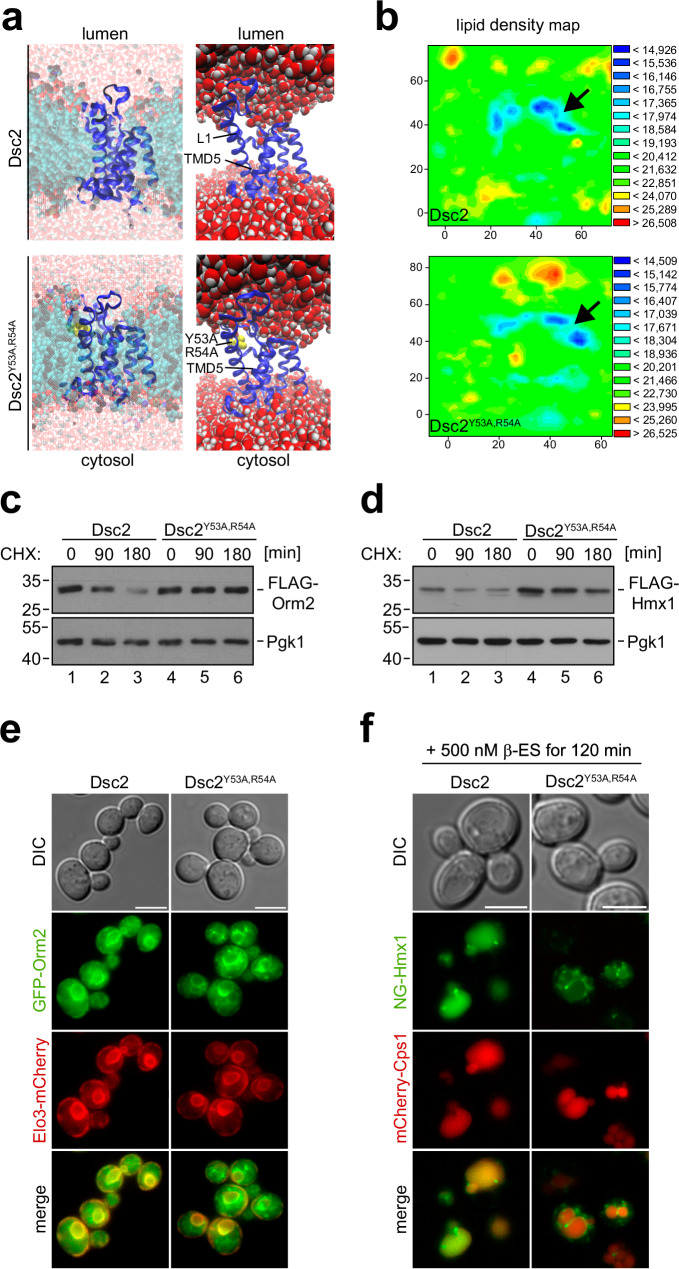
Fig. 6. The membrane thinning capacity of Dsc2 is required for substrate degradation.
a Snapshot of the molecular dynamics simulation of the rhomboid domain of Dsc2 (see also Supplementary movies 1 and 2) or Dsc2Y53A,R54A showing the entire system (including lipids and water) or just the Dsc2 rhomboid domain with water in orthographic and perspective views. b Lipid density maps of Dsc2 (see also Supplementary movie 3) or Dsc2Y53A,R54A displaying the average distances (in Å) of the center of mass in the lipid bilayer during the final converged 40 ns of the simulation. c, d SDS–PAGE and WB analysis with the indicated antibodies for the indicated cells, left untreated (0 min) or treated with CHX for the indicated time to block protein synthesis. Representative blots from three independent experiments with similar results are shown. Densitometric quantification is shown in Supplementary Fig. 6e, f. e, f Live cell epifluorescence microscopy: e GFP-Orm2 (green) and Elo3-mCherry (red); f ß-ES induced NG-ALFA-Hmx1 (green) and mCherry-Cps1 (red). Scale bars 5 µm. Representative micrographs from three independent experiments with similar results are shown.

