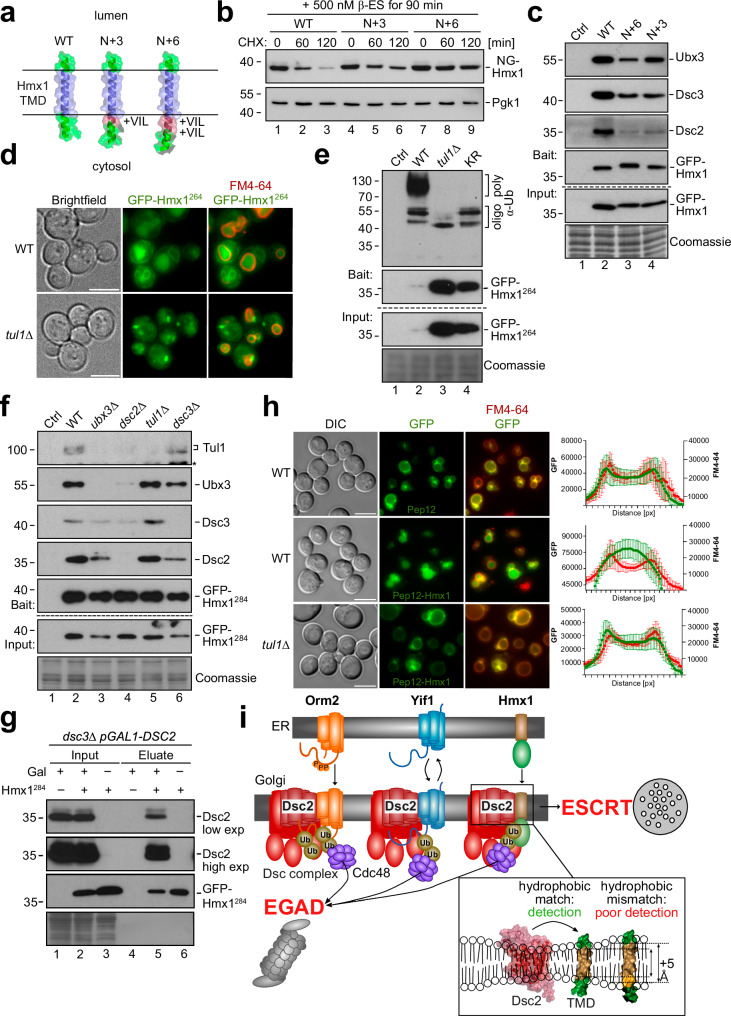
Fig. 7. The TMD of Hmx1 is a degron for the Dsc complex.
a AF models (AF-P32339-F1) showing the region including the TMD of Hmx1 from amino acid (aa) 284–317 (WT), 284 + 3 aa (N + 3), and 284 + 6 aa (N + 6). Transmembrane domain (TMD) (blue) aa 293–310 and extended α-helices (red) are colored as indicated. These constructs also encompass aa 264–317, but the cytosolic helix with aa 264–284 (including K265,269,282) is not shown. b, c, e–g SDS–PAGE and Western blot analysis with the indicated antibodies of the indicated mutants expressing the model substrates. Coomassie and Pgk1 served as a loading control. ‘*’ indicates cross-reactive bands. b NG-Hmx1 was induced for 90 min and cells were left untreated (0 min) or treated with 50 µg/mL cycloheximide (CHX) to block protein synthesis for the indicated time points. Densitometric quantification in Supplementary Fig. 7b. c Immunoprecipitations of different model substrates from tul1Δ cells. Control (Ctrl) cells were untagged WT cells. Densitometric quantification in Supplementary Fig. 7c. d, h Live cell epifluorescence of indicated cells expressing the d model substrate GFP-Hmx1264 (green) or h GFP-Pep12 (green, upper panel) or GFP-Pep12-Hmx1 (green, middle and lower panel) with FM4-64 (red, vacuolar membrane). Quantification of fluorescence intensity across 10 individual vacuoles is shown and presented as mean ± standard deviation (SD). Scale bars 5 µm. e–g Input and elution of e denaturing GFP-Hmx1264 immunoprecipitations (IP) or f, g non-denaturing GFP-Hmx1284 from the indicated cells. Control (Ctrl) cells were untagged WT strains or g uninduced cells. Representative blots from three independent experiments with similar results are shown in b, c, e–g. i Summary of Dsc complex mediated degradation of orphaned transmembrane proteins. Structural models of Dsc2 (AF Q08232 F1) and the TMD of Hmx1 (AF P32339 F1) were generated using AF.

