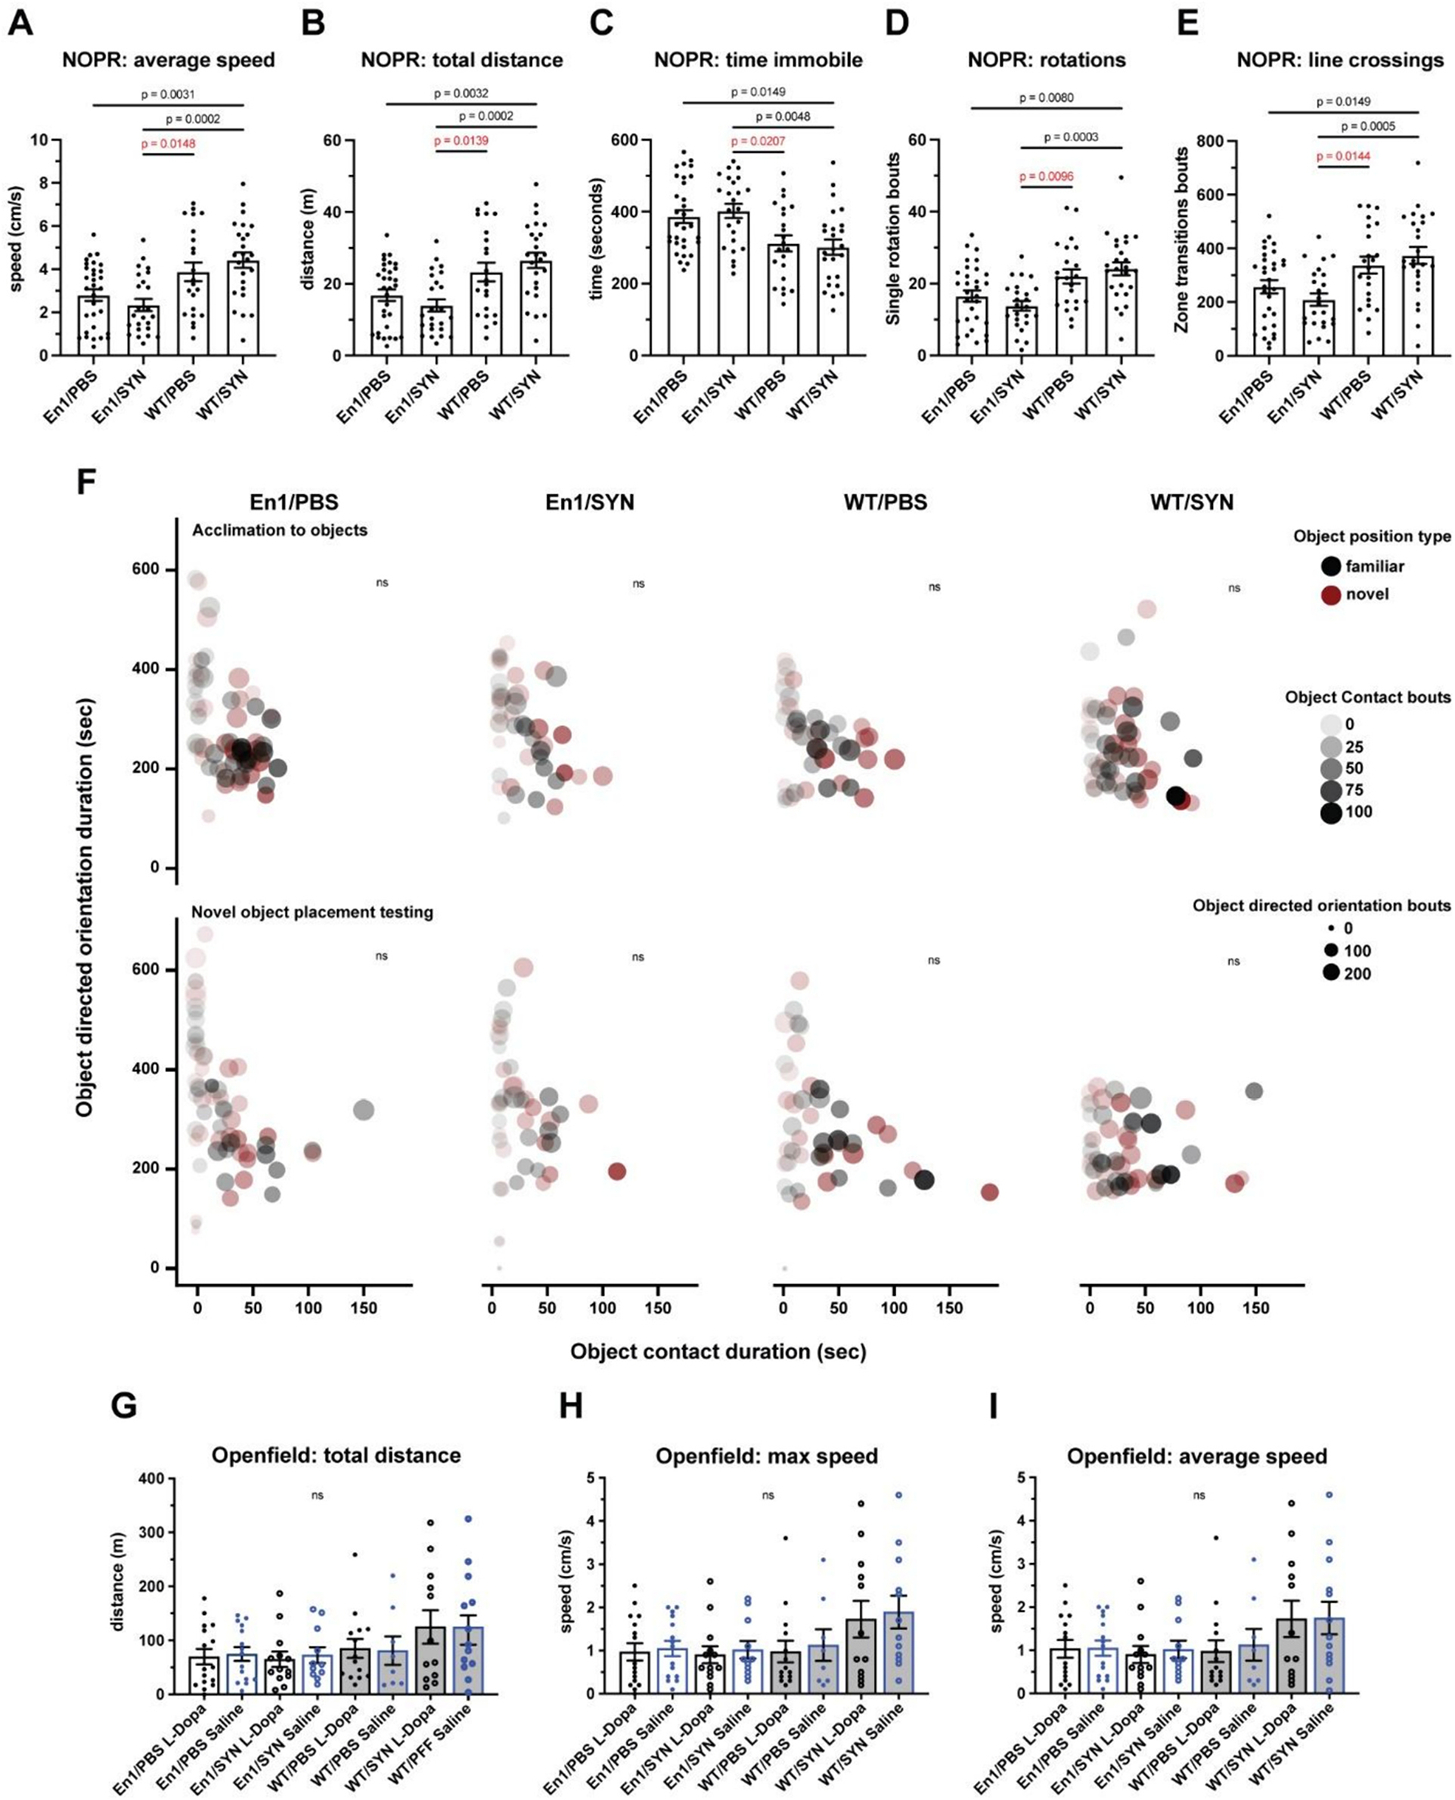
Fig. 4.

Drug treatment experiments, motor and cognitive impairment, and effects of L-dopa. 1 mouse/marker, bars = treatment group means, error bars (±SEM). One-way ANOVA, multiple comparisons test with Bonferroni correction (see data availability for additional comparisons). NOPR: En1/PBS n = 31, En1/SYN n = 24, WT/PBS n = 22, WT/SYN n = 25. A) Average speed (cm/s): (p < 0.0001, En1/SYN vs WT/SYN p = 0.0002). B) Total distance (m): p < 0.0001, En1/SYN vs WT/SYN p = 0.0002). C) Time immobile (m): (p < 0.0001, En1/SYN vs WT/SYN p = 0.0048). D) Rotations (bouts): (p = 0.0001, En1/SYN vs WT/SYN p = 0.0048). E) Line crossings (bouts): (p = 0.0002, En1/SYN vs WT/SYN p = 0.0005). Cognitive Impairment: En1/PBS n = 31, En1/SYN n = 24, WT/PBS n = 22, WT/SYN n = 25. F) No significant effects of treatment. 1 mouse/marker = mean values for object-directed orientation vs. object contact, comparing object type (familiar = black, novel = red) during acclimation (top row of bubble plots) and testing (bottom row of bubble plots). Effects of L-Dopa: G–I) Open field: No significant effects of treatment. 1 mouse/marker = mean values for locomotion; total distance (m), max speed and average speed (cm/s). L-Dopa treated (black), Saline treated (Blue), White fill (PFF) black fill (PBS). En1/PBS L-Dopa n = 16, En1/PBS Saline n = 15, En1/SYN L-Dopa n = 13, En1/SYN Saline n = 11, WT/PBS L-Dopa n = 14, WT/PBS Saline n = 8, WT/SYN L-Dopa n = 12, WT/SYN Saline n = 13.
