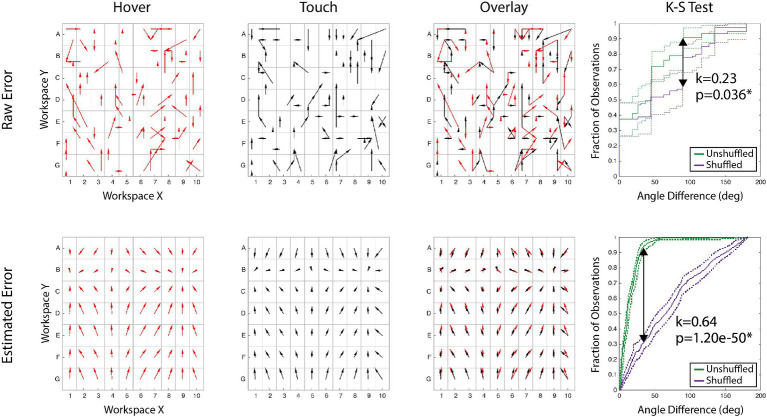
Figure 2.
Data processing example. Arrows show proprioceptive error magnitude and direction for the hover and touch conditions. Each tail is the target, and each head is the response. [Top Row] Raw error of actual responses to targets for two conditions, the overlay, and the comparison of the error maps. [Bottom Row] Modeled error of the same conditions constructed for each alphanumeric grid. The right column demonstrates the K-S test statistical process: the maximum span between the shuffled and unshuffled error distributions is denoted as ‘k’ and accompanied by the p-value of the test.

