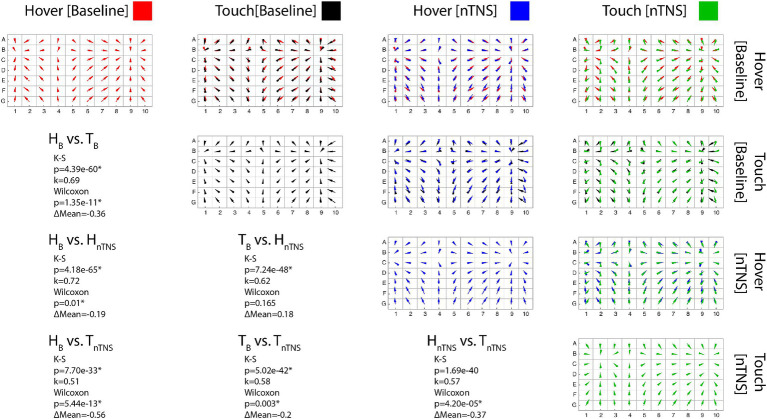
Figure 3.
Error maps comparisons. [Diagonal] Each error map shows the proprioceptive error direction and magnitude across the workspace for a single participant. (Red: Hover at Baseline; Black: Touch at Baseline; Blue: Hover after Modulation; Green: Touch after Modulation) [Upper Triangle] Conditions overlayed in each row/column pair to compare maps. [Lower Triangular] Statistical results for each pair. K-S significance implies the maps possess statistically similar shapes. Wilcoxon significance implies a difference in the error means, where positive ΔM values indicate increased mean error in the latter mode.

