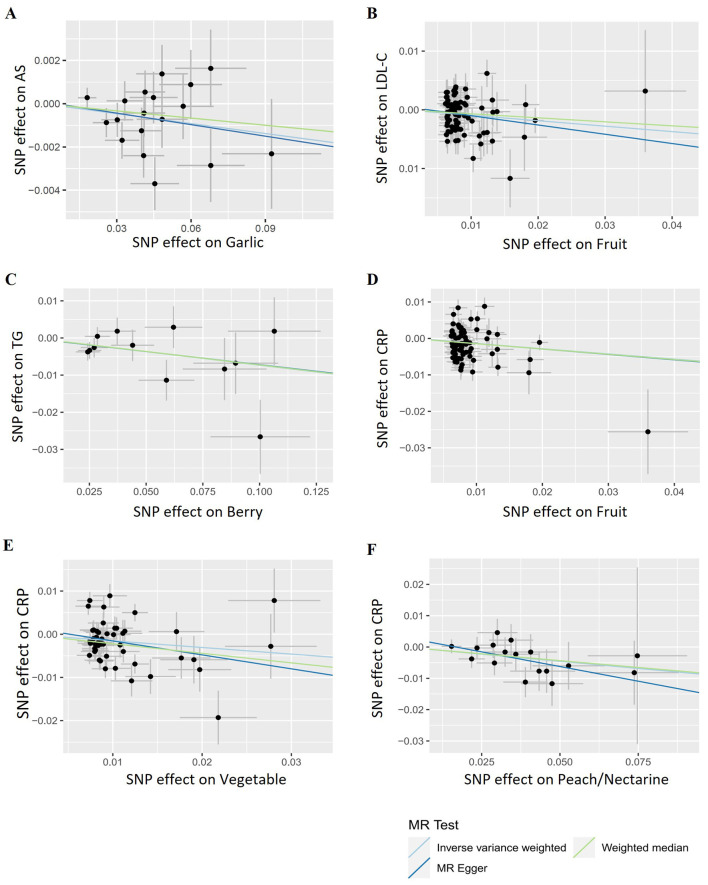
Figure 6.
Representative scatter plots of the causal relationships between fruits/vegetables and atherosclerosis as well as its risk factors. (A) Garlic and atherosclerosis. (B) Fruit and LDL-C. (C) Berry and TG. (D) Fruit and C-reactive protein (CRP). (E) Vegetable and CRP. (F) Peach/nectarine and CRP.

