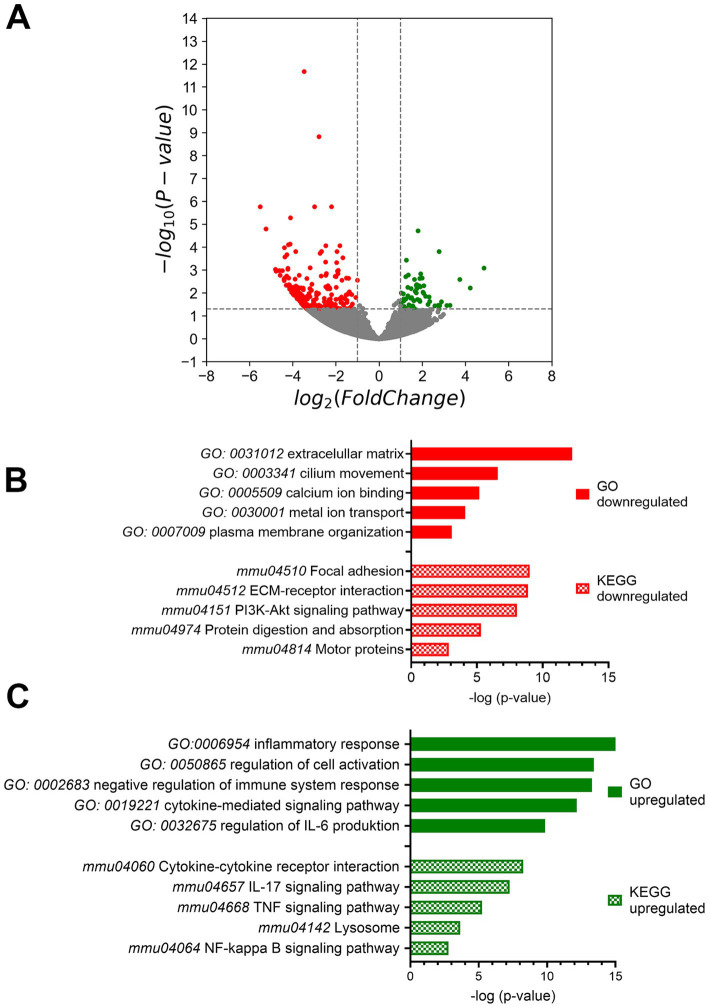
Figure 3.
Bulk mRNA sequencing analysis. (A) The mRNA expression volcano plot indicates downregulation when there was a log2fold change of -1 with a significance of p < 0.05. Conversely, upregulation was indicated when there was a log2fold change of 1 with a significance of p < 0.05 compared to control mice. (B) Gene Ontology (GO) and Kyoto Encyclopedia of genes and Genomes (KEGG) term analysis of down- and (C) up-regulated genes performed by Metascape. Ctrl: n = 4, Stat3ΔOHC: n = 3.

