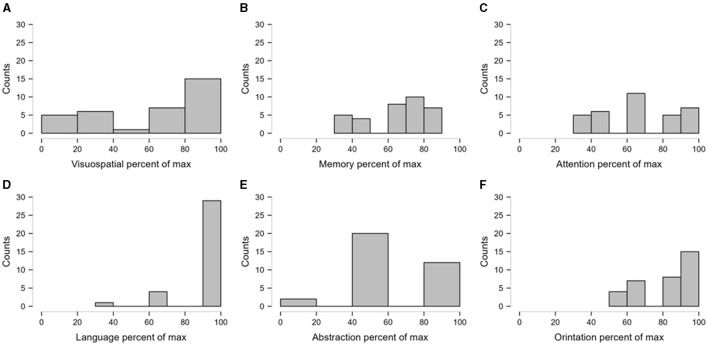
Figure 2.
The relative impairment of domains of cognitive score. The individual scores were expressed as the percentage of the maximum possible scores in the respective cognitive domains. The figure presents the frequency distributions of the transformed scores as histograms. Sturges' Rule was followed to determine the optimal number of bins in the histograms. (A, B) depict the frequency distribution of percentage of visuospatial and memory where as (C) depicts the percentage of attention score. (D–F) indicate frequency distribution of percentage of language, abstractation and orientation respectively.

