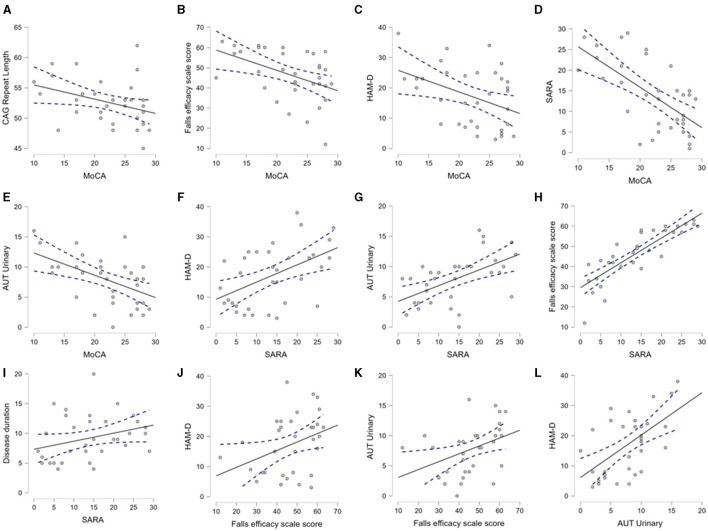
Figure 3.
Mutual association between CAG repeat length, demographic and clinical variables. The scatter plots demonstrate the significant association between the clinical, demographic, and CAG repeat length, as analyzed by Spearman's correlation. This figure selectively presents the association between the pairs of variables, where a p-value < 0.05 was found. (A–E) depict association of MoCA with CAG repeat, Falls efficacy, HAM-D, SARA and Urinary domain of autonomic scores respectively. (F–I) demonstrate association of SARA with HAM-D, Urinary, Falls efficacy and Disease duration respectively. (J, K) indicate association of Falls efficacy with HAM-D and Urinary domain of autonomic score. (L) describes association of autonomic score of urinary symptoms with HAM-D. Aut Urinary: urinary domain of autonomic dysfunction.

