
Figure 2.
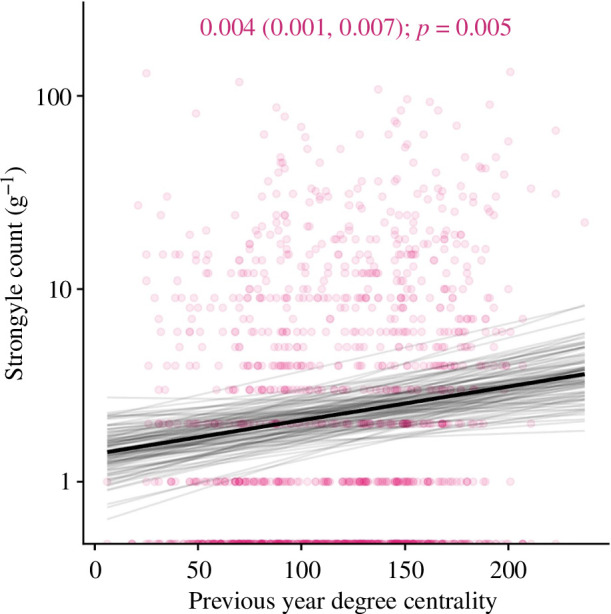
Association between social connectedness (degree centrality) in the previous year and strongyle nematode count in wild red deer. The x-axis shows number of contacts; the y-axis shows number of eggs per gram. Taken from the spatial model, the black line represents the mean of the posterior distribution for the age effect estimate; the light grey lines are 100 random draws from the posterior to represent uncertainty. The degree effect estimate, credibility intervals and p-values are given at the top of the figure. The points represent individual samples, with transparency to allow visualization of overplotting. The figure has been cropped to the distribution of the fitted lines to help visualizing the model fits, so some points outside this range have been excluded from the figure.