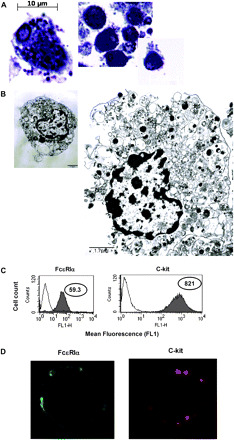
Fig. 1.

BMMC cultured in SCF and IL-3 display a mast cell phenotype. BMMC were isolated from femurs and tibias of 6-week-old BALB/c female mice and cultured with mSCF and mIL-3 for 5 weeks. (A) BMMC sections 1.5 μm thick were stained with toluidine blue and examined using a Zeiss Axioplan 2 light microscope at ×100 magnification, controlled with Zeiss Axiovision software for automatic signal acquisition. The scale bar at the bottom corner represents 20 μm. (B) BMMC sections 80–90 nm thick were examined using a JEOL 100CXII transmission electron microscope at 60 kV. The image shows typical mast cell morphology with a large eccentric nucleus surrounded with dense material concentrated around the periphery. Several dense cytoplasmic granules are also visible. The scale bar represents 1.7 μm. (C) Flow cytometry was used to examine surface expression of FcεRIα and c-kit. The control peak (‘C’) is indicated for each antibody. Data are represented in log values indicating mean fluorescent intensity (MFI). The data were analyzed using FACScan flow cytometry software. (D) Surface distribution of FcεRIα (green) and c-kit (red) was determined by immunostaining and confocal microscopy at ×100 magnification.
