
Fig. 2.
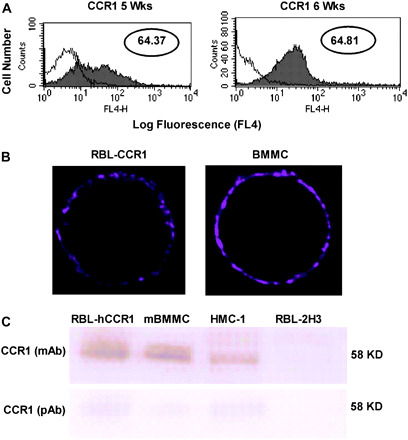
BMMC cultured in IL-3 and SCF express CCR1 protein. (A) Flow cytometry was used to examine cell surface expression of CCR1 in BMMC cultured for 5 weeks (left panel) and 6 weeks (right panel) in SCF and IL-3. The control peak (‘C’) is indicated for each antibody. Data are represented in log values indicating mean fluorescent intensity (MFI). (B) Surface distribution of CCR1 was determined for RBL-CCR1 cells (left panel) and BMMC cultured for 6 weeks in SCF and IL-3 (right panel), using immunofluorescence and confocal microscopy at ×100 magnification. (C) Western analysis was conducted using total cell lysates eluted from a protein G column and incubated with mAb and polyclonal (pAb) antibody. The two anti-CCR1 antibodies were incubated with lysates from RBL-CCR1 cells, BMMC and human mast cells (HMC-1). RBL-2H3 cells served as a negative control. With both antibodies the bands were observed at 58 kDa. The mAb is specific for human CCR1, whereas the pAb is specific for human and murine CCR1.