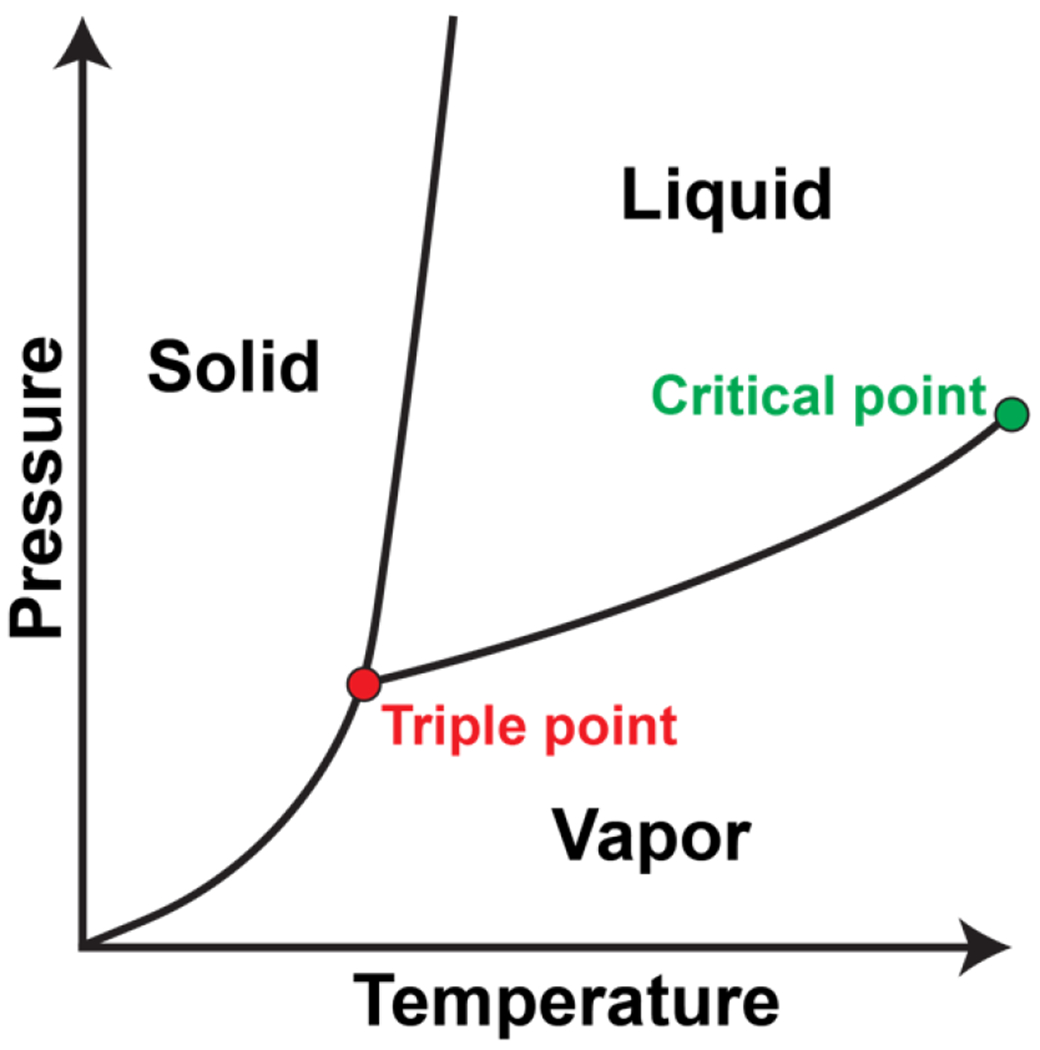
Figure 14: Pressure-temperature phase diagram of a substance that can be in a liquid, solid, or vapor phase.

The red circle indicates the triple point where all three phases coexist. The green circle indicates the critical point where the vapor-liquid coexistence curve terminates. Beyond this critical point, the system forms a single fluid phase.
