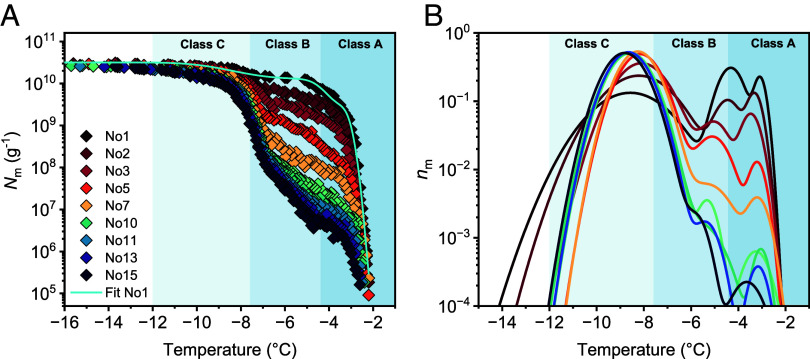
Fig. 2.
Freezing experiments of aqueous samples containing bacterial INs from P. syringae after repetitive freeze-thaw cycles. (A) Cumulative number of INs per unit mass of P. syringae (Nm). The cyan line represents the optimized solution obtained through the HUB method, assuming that the differential spectrum is a linear combination of three Gaussian subpopulations. (B) Normalized distribution function that represents the corresponding differential freezing spectra nm(T).

