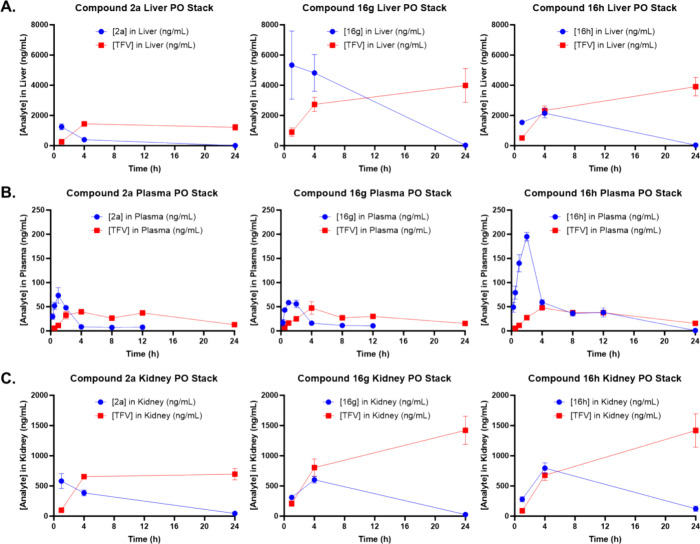
Figure 6.
Mouse plasma and liver pharmacokinetic profiles of HTP-derived analogs of TXL. Male C57BL/6 mice (n = 3 per time point) were administered a single oral dose (10 mg/kg) of TFV prodrug using 90:10 olive oil:EtOH as a vehicle. Plasma, liver, and kidney levels of prodrug and TFV were quantified using LC–MS/MS. Liver (A), plasma (B), and kidney (C) concentrations of TFV prodrug and TFV metabolite are plotted together. Data represent the mean concentration at each time point ± SEM. The figures are generated with GraphPad Prism v9.

