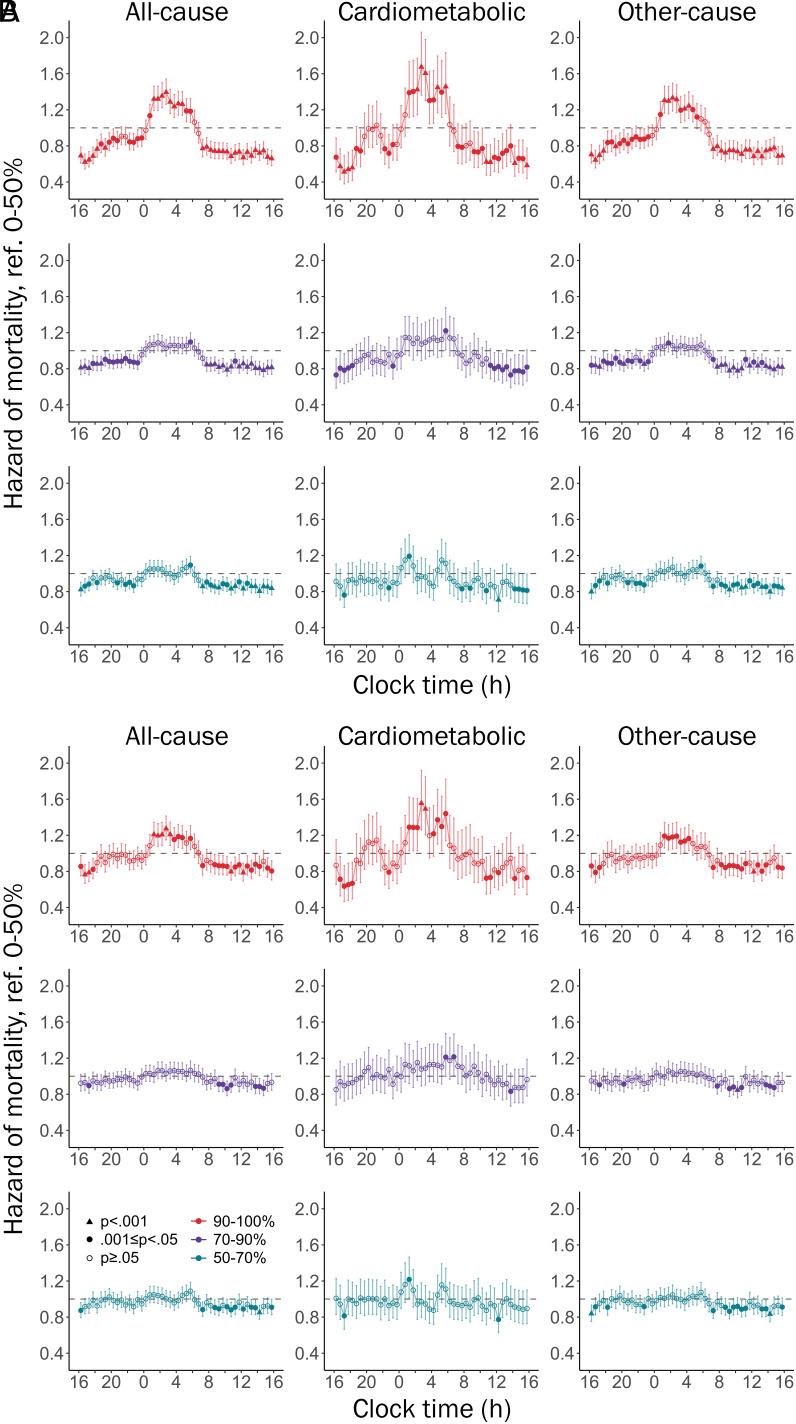
Fig. 1.
Hazard ratios [95%CI] of all-cause, cardiometabolic, and other-cause mortality for light exposures across 24 h, including Model 1 (A) and Model 3 (B). Separate models were implemented for each half-hour clock time interval, with each model including 50 to 70%, 70 to 90%, and 90 to 100% light percentile groups referenced against 0 to 50%. Bonferroni correction for multiple comparisons required P < 0.001 for statistical significance. For example, in column one of Panel A, individuals in the 90 to 100th percentiles of light exposure at 04:00 had a significantly higher risk of all-cause mortality than those in the 0 to 50th percentiles (HR = 1.27), whereas individuals in the 50 to 70th percentiles and 70 to 90th percentiles at 04:00 did not have a significantly higher mortality risk. See SI Appendix, Fig. S2 for mortality risk by 24-h light exposures adjusted for Model 2 covariates.

