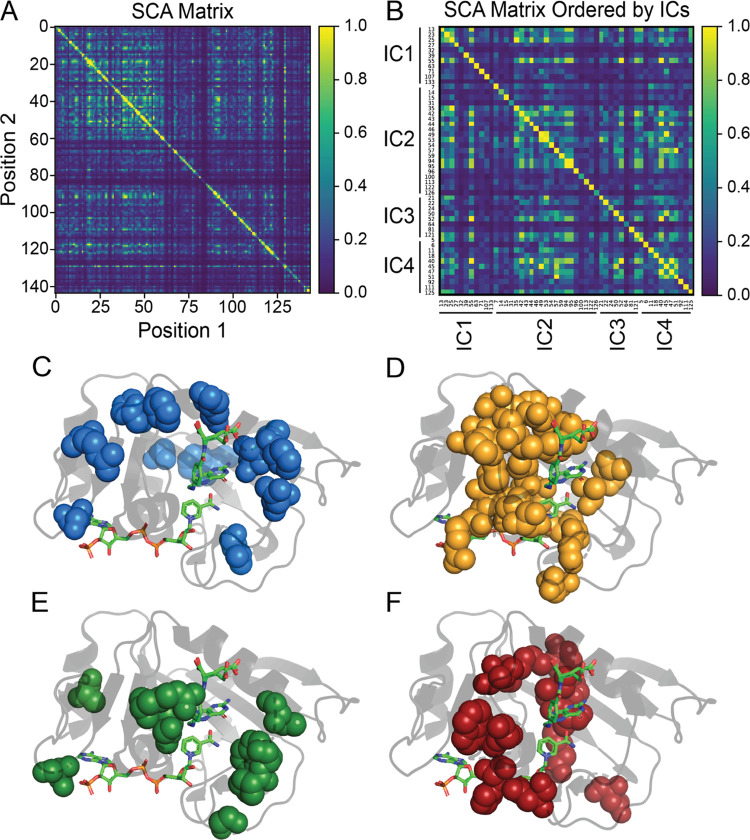
Figure 1.
SCA matrix (A) constructed using the pySCA package as well as a custom matrix with IC contributors ordered numerically as (B). Additionally, the respective mapping of each independent component (IC1 - IC4) in DHFR, as determined by statistical coupling analysis, is shown in panels (C–F). The specific positions contributing to each IC can be found in panel (B).

