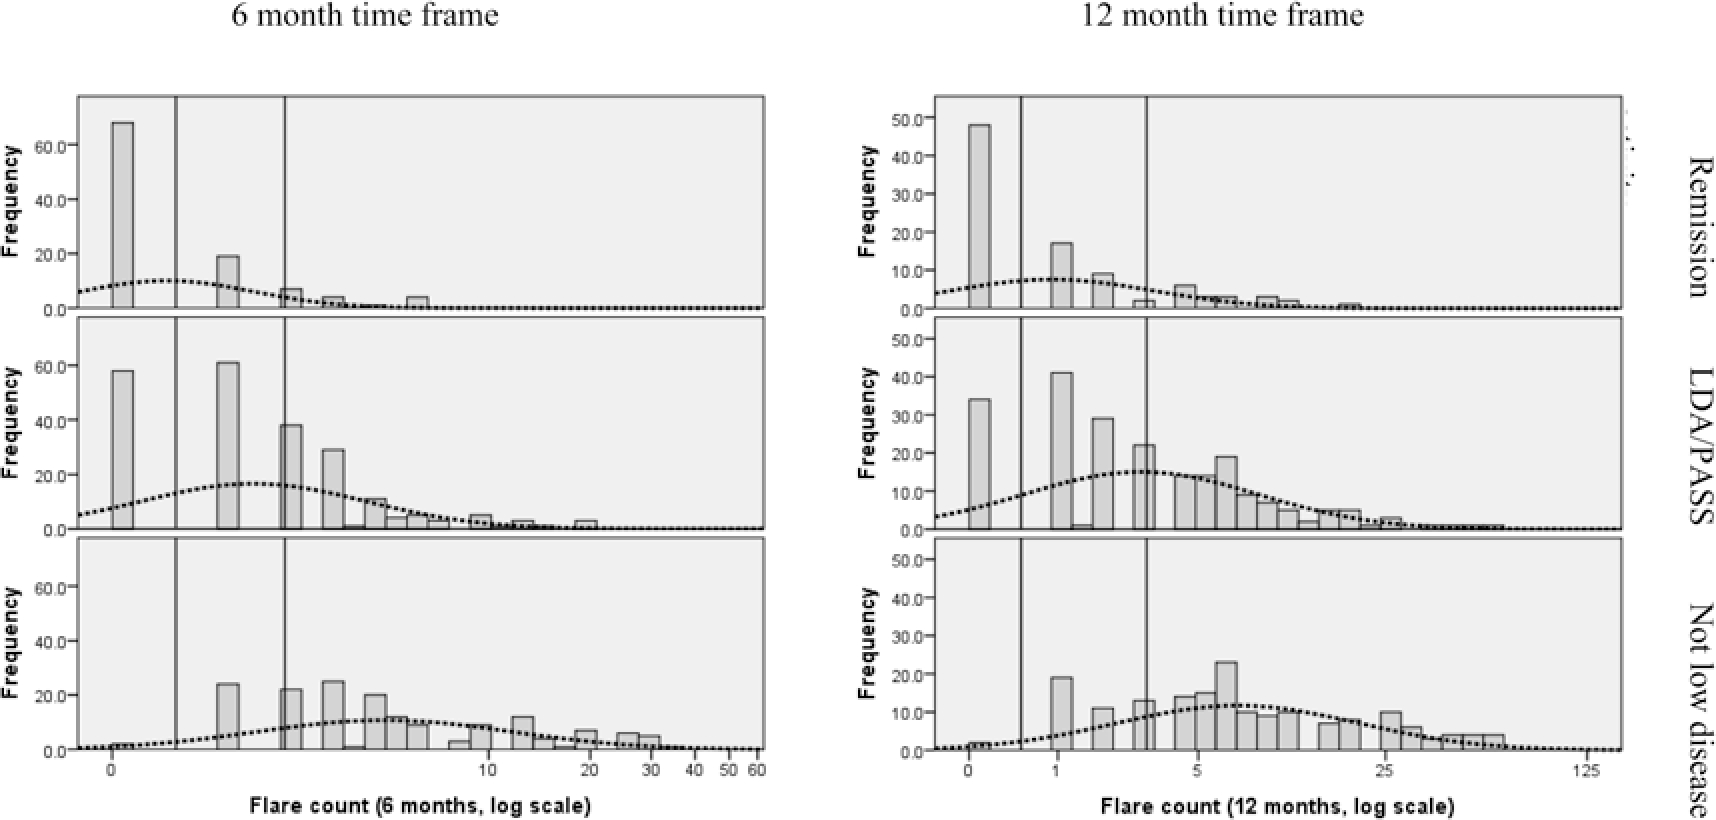
Figure 1.

Distribution of flare counts by disease activity state. The dotted line represents the normal distribution of the log-transformed flare count. The vertical lines represent suggested thresholds for remission (0 flares for both 6 and 12 months) and LDA/PASS (1–2 flares for 6 months; 1–3 flares for 12 months). Two thresholds are required to divide the disease activity into 3 states: remission, LDA/PASS, and higher disease activity. LDA: low disease activity; PASS: patient acceptable symptom state.
