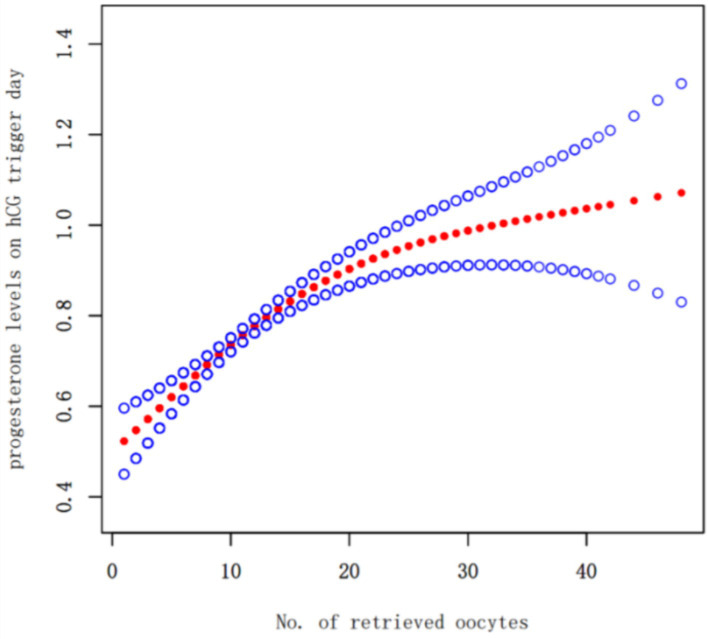
Figure 2.
Fitting curve of no. of retrieved oocytes and progesterone levels on hCG trigger day the solid-dotted red line represents the smooth curve that fits between variables. Blue curves represent the upper and lower limits of the 95% CI. Adjusted for age, body mass index,the duration of infertility and infertility type.

