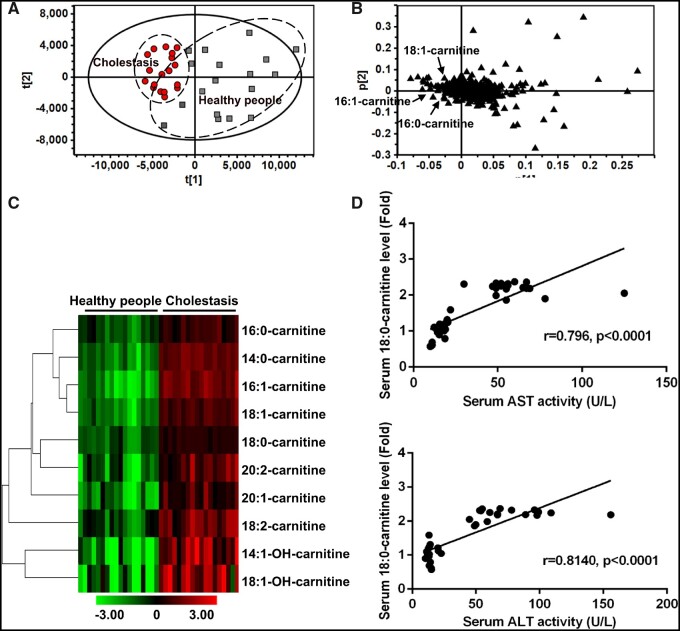
Figure 6.
Long-chain acylcarnitines in cholestatic liver injury patients. Principal component analysis score plot (A) and loading plot (B) derived from UPLC-QTOFMS data of serum ions. Each point represented an individual serum sample (-left) and an ion in the sample (-right). Metabolites were labeled in the loading plot (■, Healthy people; ●, Cholestasis). C, Heat map analysis of long-chain acylcarnitines between cholestasis and healthy people. D, Correlation analysis between the levels of 18:0-carntine and serum AST and ALT. Correlation factor (r) and p value were estimated with Pearson’s correlation analysis. All data were expressed as mean ± SEM.

