Figure 2.

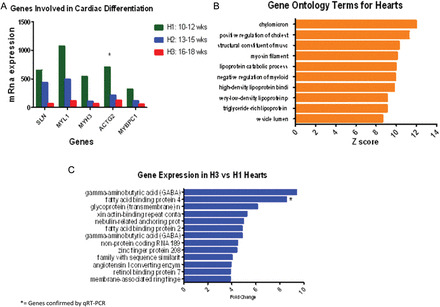
(A) mRNA gene expression of regulators of cardiomyocyte differentiation. All transcripts are increased in the late first trimester (H1) versus the early second trimester (H3). Differences are measured by mRNA level on genes with a differential expression >95%, after adjusting for an FDR of 5% using EBarrays (Newton et al., 2001; Kendziorski et al., 2003), to identify differentially expressed genes in any two conditions. SLN, Sarcolipin; MYL1, Myosin light chain 1; MYH3, Myosin heavy chain 3; ACTG2, Actin gamma. * = gene verified by qRT–PCR. (B) Bar chart showing terms from Gene Ontology in the heart, classified according to biological process, cellular component and molecular function using test for enrichment of common functions among sets of differentially expressed genes (Gene Ontology Annotations and the KEGG). Gene families involved in common functions for muscular development like myosin filament and fatty acid metabolism including chylomicron, cholesterol, lipoprotein binding proteins and triglyceride lipoprotein are the highest ranked in the cardiomyocytes from 10 to 18 weeks of gestational age (pooled data). (C) Genes with the highest differential expression in the early second trimester hearts (H3). Tissue samples correspond to hearts from 10–12 weeks of gestational age (H1) and 16–18 weeks of gestational age (H3) pooled on two separate Human Gene 1.0 ST array, according to gestational age. Differences are measured by fold change (>2), after adjusting for an FDR of 5% with a differential expression >95% using EBarrays (Newton et al., 2001; Kendziorski et al., 2003), to identify differentially expressed genes in any two conditions. *= gene verified by qRT–PCR.
