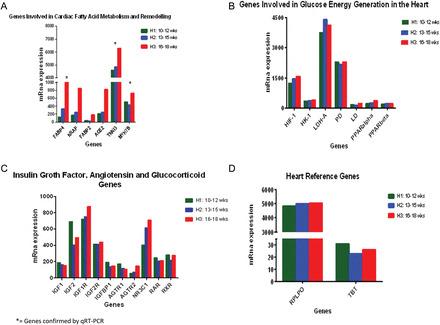
Figure 3.

(A) mRNA gene expression of regulators of the cardiac fatty acid metabolism and remodeling. All transcripts are increased in the early second trimester as the heart matures, compared with the late first trimester. Differences are measured by mRNA level on genes with a differential expression >95%, after adjusting for an FDR of 5% using EBarrays (Newton et al., 2001; Kendziorski et al., 2003), to identify differentially expressed genes in any two conditions. *= genes verified by qRT–PCR. (B) mRNA expression of regulators of glucose energy generation by the cardiomyocytes. All transcripts are high in both groups showing no significant differential expression (<0.005), after adjusting for an FDR of 5%. (C) mRNA gene expression of insulin growth factor and angiotensin. Specific transcripts were examined due to the their suggested importance in previous studies (see introduction). mRNA levels detected in each group are shown. Differential expression >95%, after adjusting for an FDR of 5% using EBarrays (Newton et al., 2001; Kendziorski et al., 2003), was not achieved suggesting that these genes are not differentially controlled across early gestation. (D) Reference genes in the heart. The graph shows mRNA expression of two candidate genes without significant change in expression, regardless of the experimental group (H1, H2 or H3). Reference genes were validated by the method of Stern-Straeter et al. (2009). All H1, H2 and H3 groups of hearts were analyzed under exact conditions. Differential expression was <0.005 for both genes under the two conditions. RPLP0: Ribosomal protein, large; TBS: TATA box binding protein.
