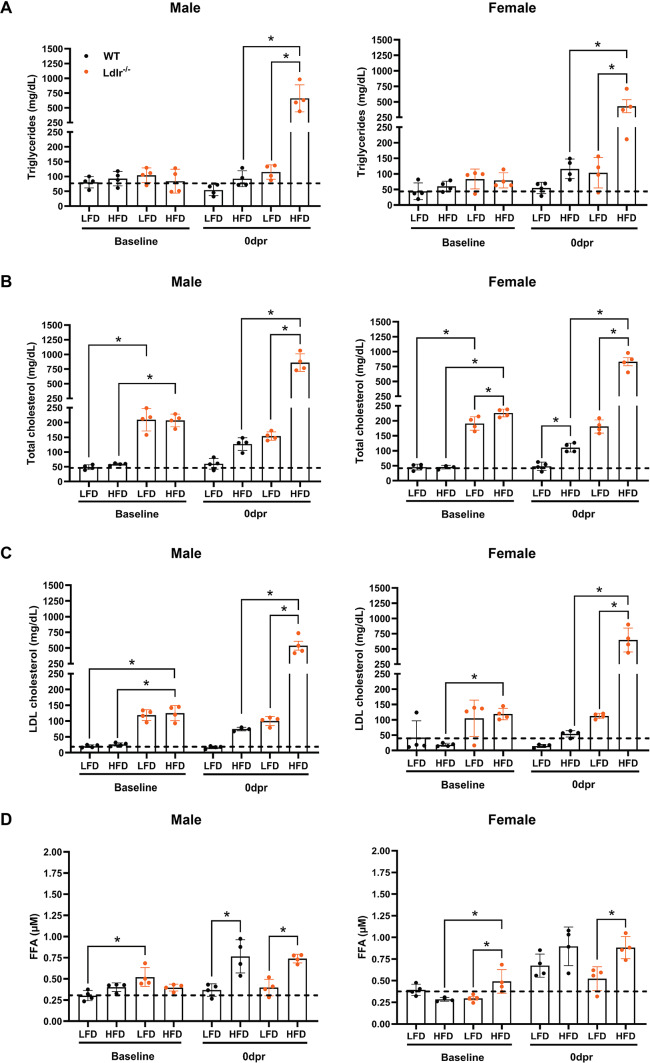
Fig. 2.
Systemic lipid profiles after HFD-induced hypercholesterolemia in Ldlr−/− mice. Plasma concentrations of (A) triglycerides (mg/dL), (B) total cholesterol (mg/dL), (C) LDL cholesterol (low-density lipoprotein—mg/dL), and (D) FFA (Free fatty acids—µM—micromolar) in male and female mice with deletion of the low-density lipoprotein (LDL) receptor (Ldlr−/−) and age- and sex-matched wild-type (WT) control before (baseline) and 10 days after being exposed to a low-fat diet (LFD) or high-fat diet (HFD), which corresponds to the time point when the rib resection surgeries were performed (0 dpr). The dashed lines represent the overall mean value of the group of WT mice under LFD at baseline and were used as a reference in each graph for comparison with all other groups. Data are displayed as the mean ± SD (n = 4 in each group). Statistical analysis was performed using two-way analysis of variance (ANOVA) followed by Fisher’s LSD test. Significant differences between groups are expressed as *p < 0.05. dpr = days post-resection.

