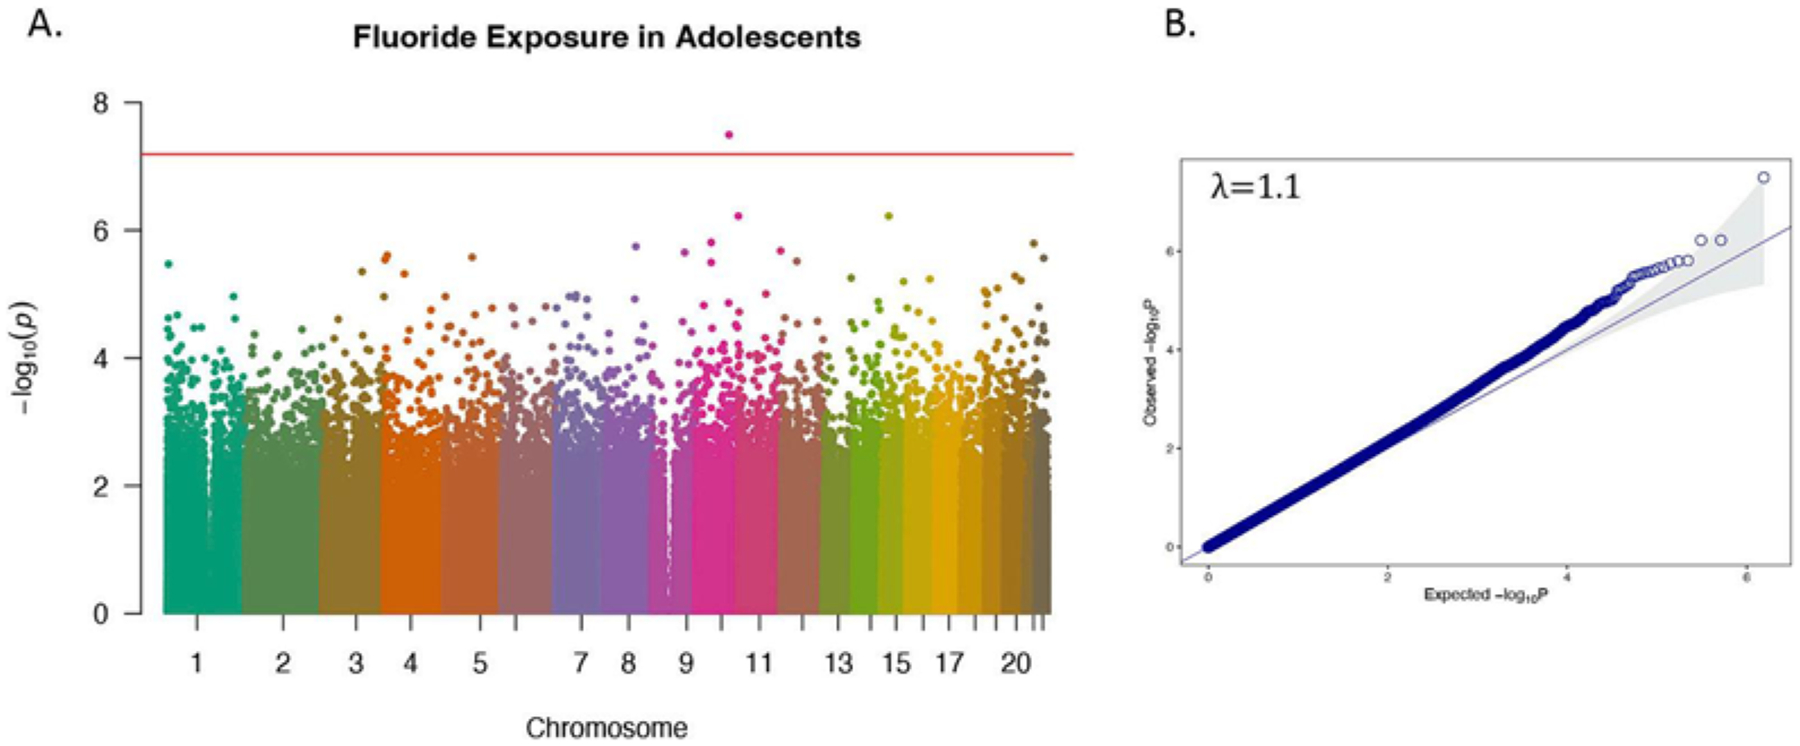
Fig. 1.

Manhattan plot (A) and related quantile-quantile plot (B) showing sites of DNA methylation in whole blood associated with log-transformed childhood urinary fluoride (CUFsg) concentration in the CCAAPS total cohort. Red line indicates epigenome-wide significance based on Bonferroni, (p < 6 × 10⁻⁸). Methylation of CpG sites that are significantly associated with log-transformed CUFsg are depicted by dots above the red line.
