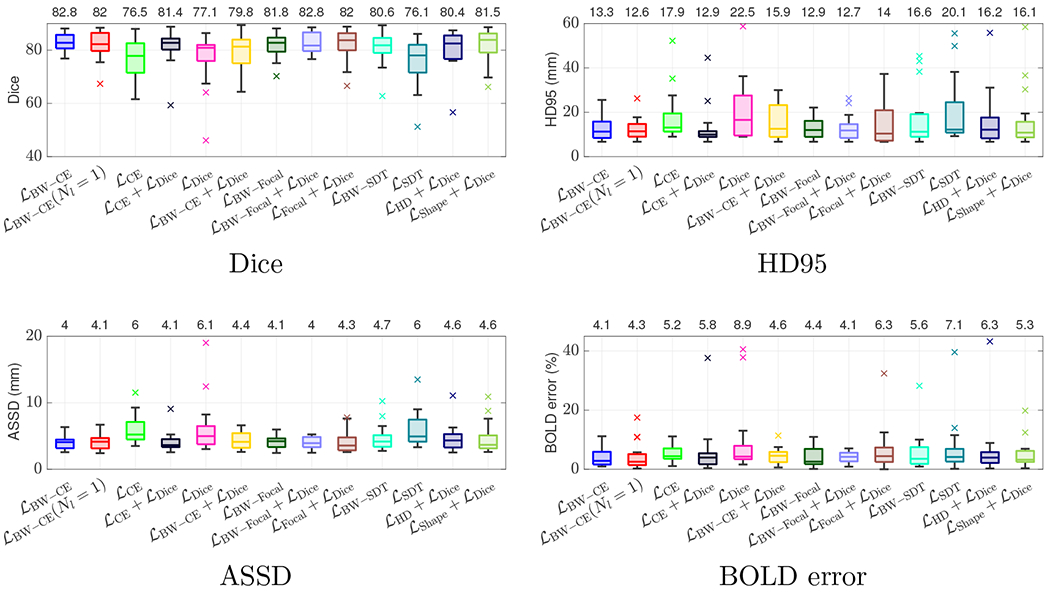
Figure 3:

Box-and-whisker plots of Dice (top left), HD95 (top right), ASSD (bottom left), and BOLD error (bottom right) on the test set across all models. We evaluate several commonly used loss functions with and without our boundary weighting and evaluate the baseline shape-based loss () of Huang et al. (2021) and the soft-Hausdorff distance loss () of Karimi and Salcudean (2019). Black horizontal lines inside the box indicate the median. The boxes extend to the and percentiles and the whiskers reach to the most extreme values not considered outliers (black bars). The outliers, shown as crosses, are points farther than 1.5 times the interquartile range. Mean values are indicated on the top horizontal axis. Boundary weighting results in higher mean values with more narrow distributions of distortion compared to their non-boundary weighted counterparts. We further observe improved performance compared with baseline losses in terms of mean, variance, and number of outliers.
