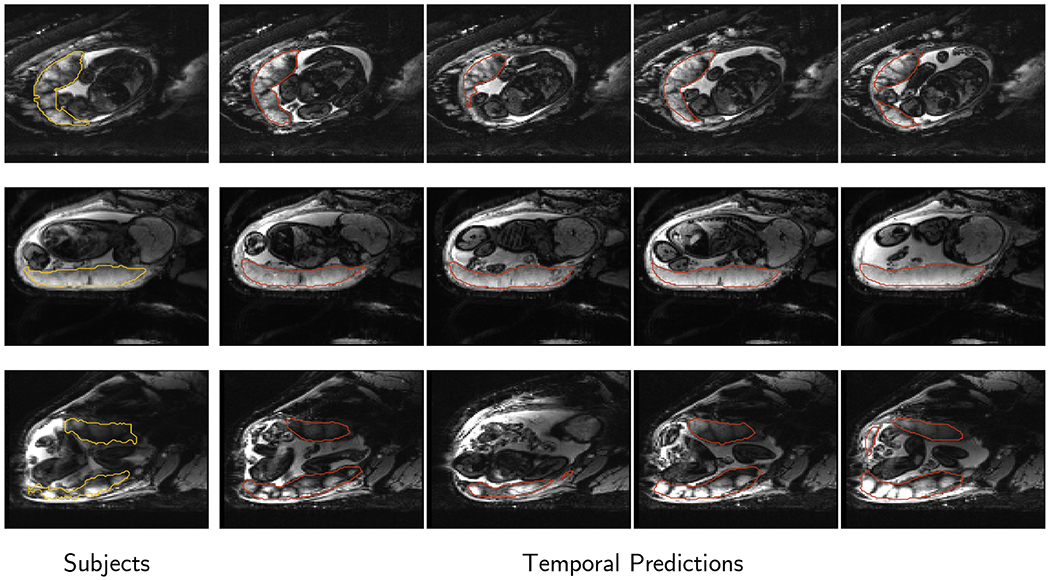
Figure 5:

Consistency of predictions throughout the time series on 3 subjects from the test set. Each row corresponds to a subject. The leftmost column shows the ground truth segmentation outlined in yellow, and temporal-predicted segmentations in columns are shown in red. The same axial slice is shown for each subject, and images span the time series. Segmentations are consistent across time series, achieving consecutive BOLD differences of , and and Dice scores of , and (top, middle, and bottom). Variations in these metrics are expected due to fetal motion and changes in oxygenation due to the BOLD protocol.
