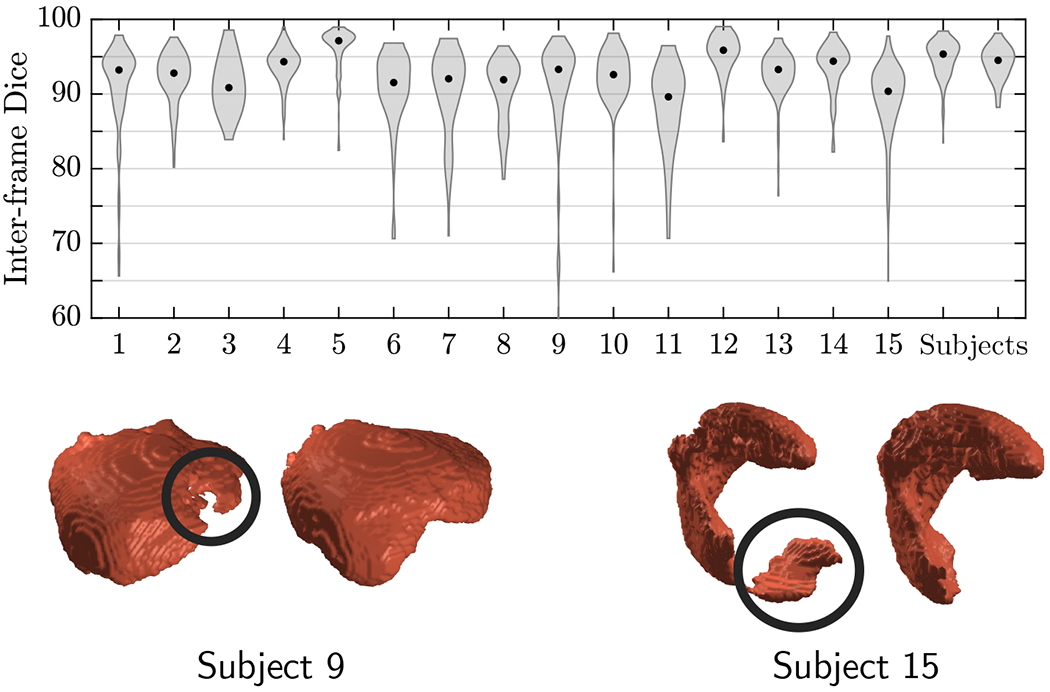
Figure 6:

Top: Per-subject density distributions of Dice scores between consecutive predictions in BOLD MRI time series. Dots inside distributions indicate the median. Bottom: Example failure cases at frames with Dice . 3D models of placentae predicted at two consecutive time points are shown for two subjects. Left: The region in black is distorted in the predicted segmentation of subject 9. Right: A large portion of the placenta (encircled) is wrongfully predicted in the placenta of subject 15. Failure cases are likely to occur with large drops in consecutive Dice (Dice ).
