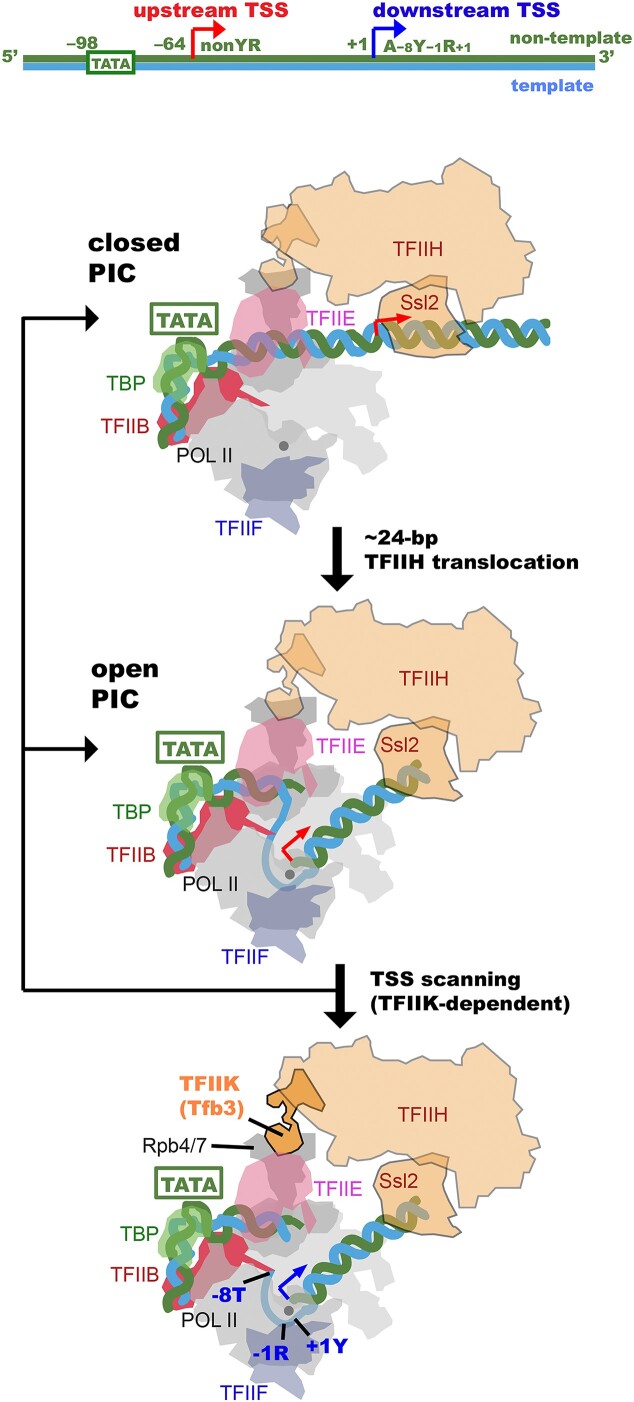
Figure 5.
Schematic representation of TSS scanning in yeast. Schematic representation to show how the closed PIC (top panel) transitions to the open complex (middle panel) and facilitates TSS scanning (bottom panel) by the TFIIH translocation. DNA is blue and green. Tfb3 is orange. Upstream and downstream TSSs are indicated by red and blue arrows. The catalytic metal ion A in the pol II active center is indicated by a gray ball.

